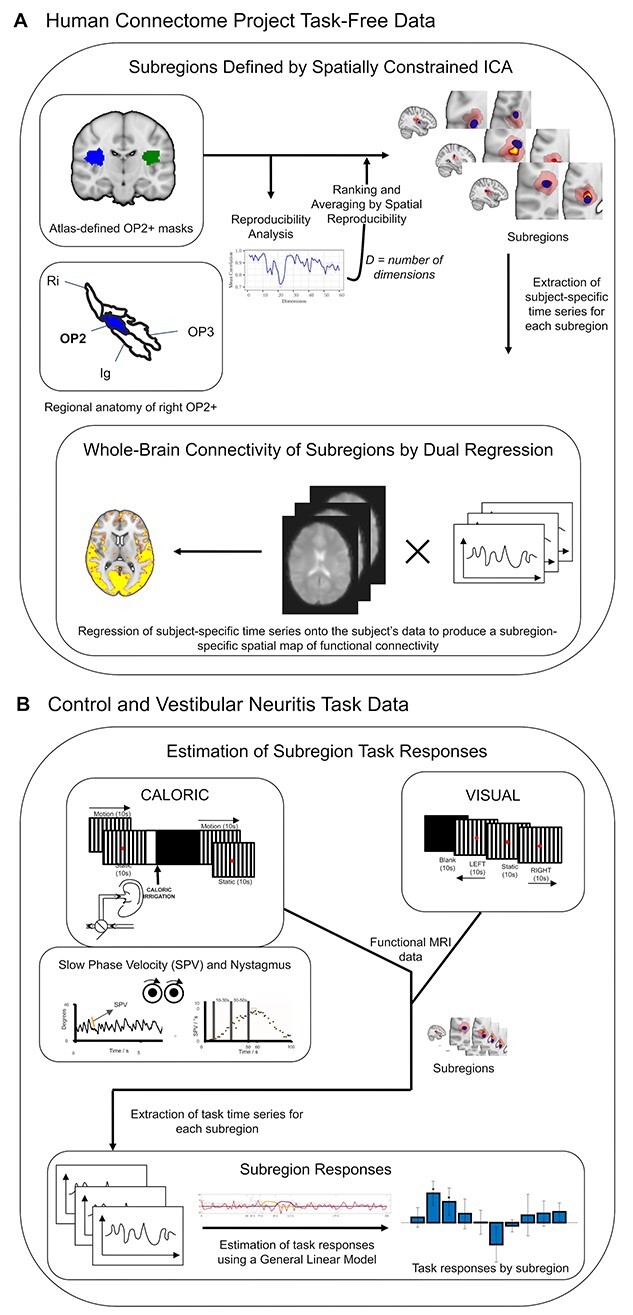
Fig. 1.

Overview of methods. (A) Spatially constrained ICA of area OP2+ within Human Connectome Project task-free data produced spatial maps of subregions in each hemisphere. Between-subject reproducibility was maximized and reproducibility was further enhanced by ranking and averaging by spatial reproducibility. The whole-brain connectivity of each subregion was then estimated by dual regression. The regional anatomy of right OP2+ (in blue) is shown on an inflated brain relative to areas OP1, OP3, the retroinsular cortex (Ri), and the insular granular cortex (Ig); the images are adapted with permission from Indovina et al. (Indovina et al. 2020) (B) CALORIC and VISUAL tasks were performed. The trace on the left is an example of right-beating nystagmus during cool caloric irrigation of the left ear; the orange line depicts SPV, which is defined as the gradient of the slow phase of nystagmus; the adjacent trace is a typical profile of the evolution of SPV over time following caloric irrigation at time zero; the time periods (10–30 and 30–50 s) that define the caloric contrast are illustrated.
