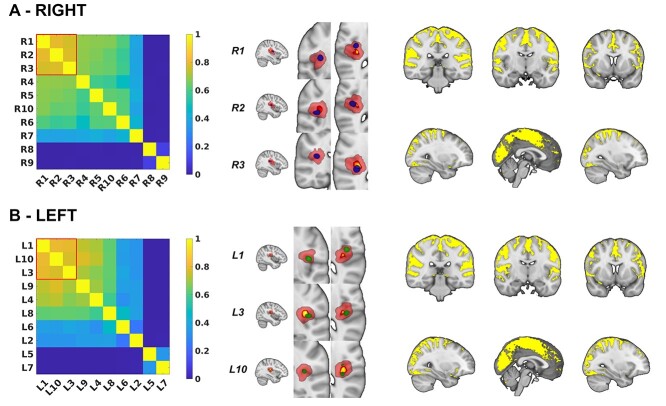
Fig. 4.
Common patterns of vestibular connectivity from OP2+ subregions. (A) Spatial similarity matrix for the whole-brain connectivity of right OP2+ subregions as measured by the Dice coefficient. Red square highlights 3 subregions with similar networks (R1 [anterior OP2+], R2 [lateral OP2+], and R3 [posterior OP2+]). These 3 subregions are illustrated in blue, on a background of the OP2+ mask in red. The core/central area of the OP2+ mask (P > 0.5 in Jülich atlas) is shown in yellow. Adjacent is a map of common functional connectivity from the 3 subregions (yellow, P < 0.05). (B) Spatial similarity matrix, OP2+ subregions (in green) and common functional connectivity for left OP2 +.

