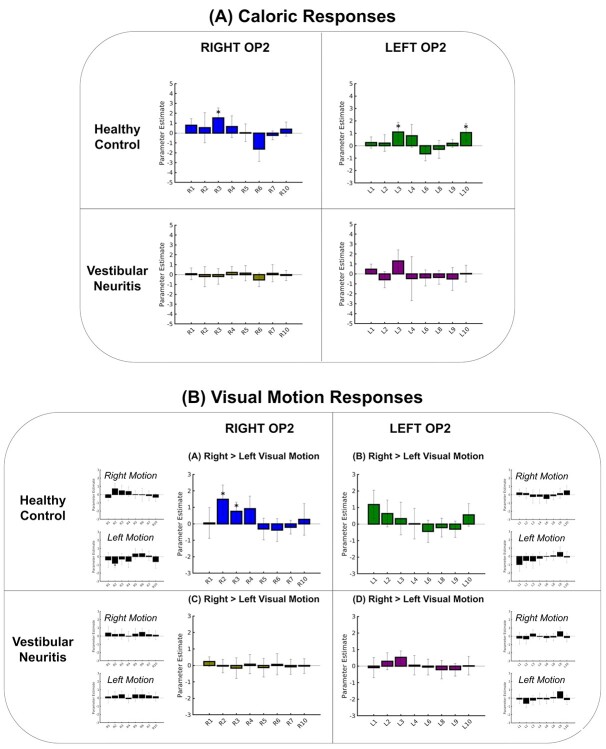
Fig. 6.
Caloric and visual motion responses in OP2+. (A) Caloric responses in healthy controls and patients with vestibular neuritis within right and left OP2+ subregions. (B) Visual motion responses in healthy controls and patients with vestibular neuritis. Larger bar charts show OP2+ subregion responses for motion selectivity (right > left visual motion). Smaller bar charts show specific responses to rightward and leftward motion (motion > static visual stimulation). Asterisk indicates significant activation relative to baseline, FDR-corrected.

