Figure 1.
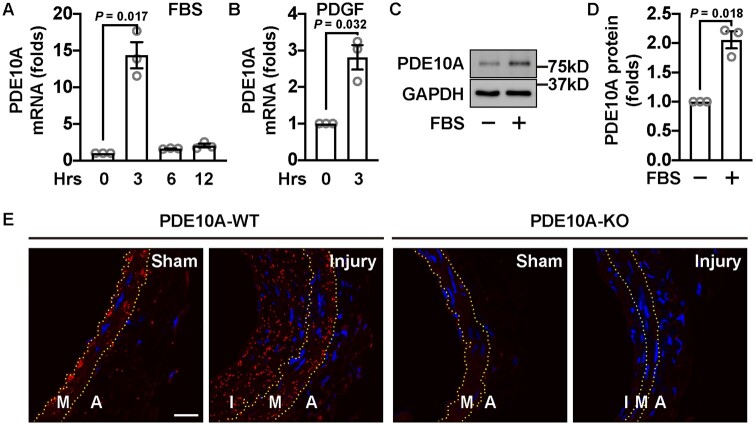
PDE10A expression level is increased in growing SMCs in vitro and SMC-like cells in intimal lesions in vivo. (A) RT-qPCR results showing relative PDE10A mRNA levels in rat SMCs stimulated with FBS for different amounts of time. Cells were starved for 2 days before being treated with 10% FBS. n = 3 for each group. A one-sample t-test was performed to determine the significance of the fold change. (B) RT-qPCR results showing PDGF-induced PDE10A expression in rat SMCs. Cells were serum-deprived for 2 days and then treated with 10 ng/mL PDGF-BB for 3 h. A one-sample t-test was conducted. n = 3 for each group. (C) Immunoblots showing PDE10A and GAPDH levels of rat SMCs with FBS stimulation. Cells were starved for 2 days and then incubated with 10% FBS for 6 h. (D) Quantitative results of (C). n = 3 for each group. The signal of PDE10A bands was first normalized to the input and then normalized to the group without FBS treatment. A one-sample t-test was performed. n = 3 for each group. (E) Representative images of the proximity ligation assay on PDE10A expression in cross-sections of wire-injured mouse femoral arteries. The left femoral arteries were injured and the right femoral arteries served as sham controls. Femoral arteries were harvested 4 weeks after the surgery. Yellow dash lines indicate the internal and external elastic laminae. A, adventitia; I, intima; M, media. Similar observations were obtained from tissue samples from at least three different mice. Scale bar = 20μm. All data are shown as mean ± SEM.

