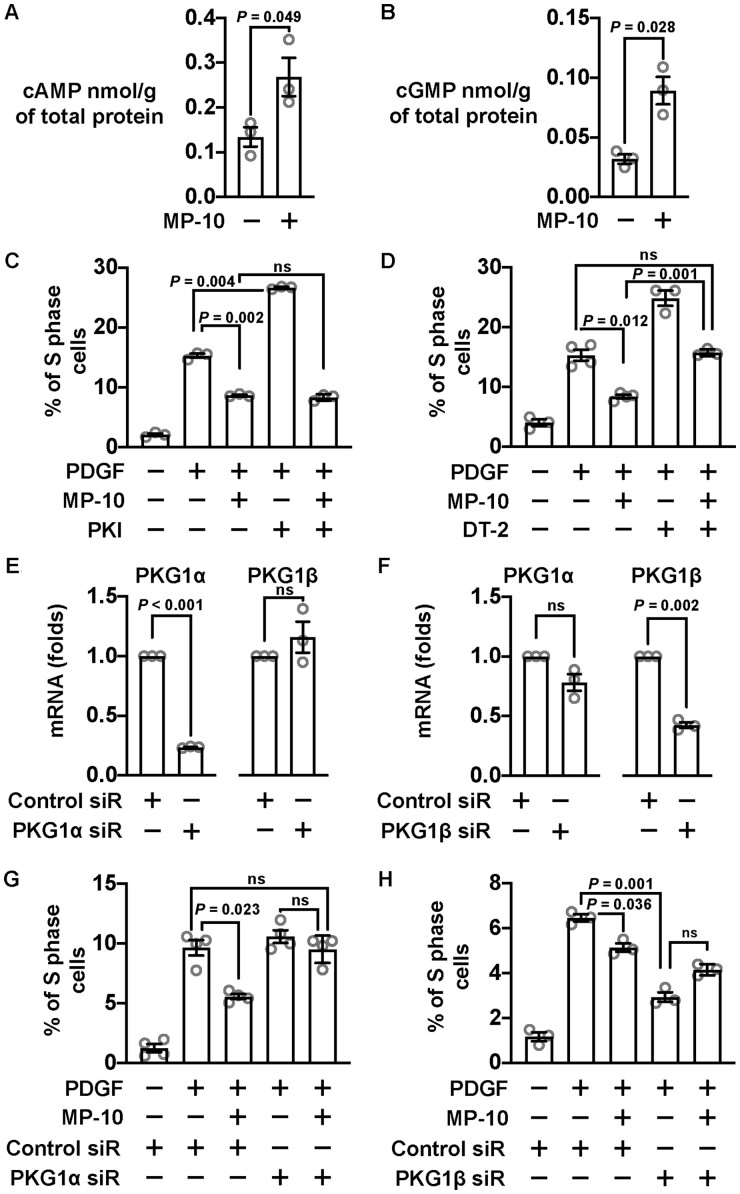
Figure 4.
PDE10A modulated SMC proliferation involves cGMP signalling pathway. (A) cAMP ELISA results showing the change of cAMP concentration after rat SMCs were treated with 5 μM MP-10. An unpaired Student’s t-test was performed. n = 3 for each group. (B) cGMP concentration changes after MP-10 treatment revealed by cGMP ELISA. An unpaired Student’s t-test with Welch’s correction was conducted. n = 3 for each group. (C) Percentages of S-phase cells after being stimulated by 10 ng/mL PDGF and treated with 2.5 μM MP-10 and 10 μM PKI (a PKA inhibitor). Cells were starved for 2 days before PDGF stimulation. A Welch’s ANOVA with Dunnett’s T3 multiple comparison test was performed to determine the effects of MP-10 and PKI on SMC proliferation. n = 3 for each group. (D) Percentages of S-phase cells treated with 2.5 μM MP-10 and 5 μM DT-2 (a PKG inhibitor). A Welch’s ANOVA with Dunnett’s T3 multiple comparisons test was applied. n = 3–4 for each group. (E) RT-qPCR results showing the mRNA levels of PKG1α and PKG1β after knocking down PKG1α in rat SMCs. The expression levels were normalized to negative control siRNA groups. One-sample t-tests were performed to determine the knockdown efficiency. n = 3 for each group. (F) RT-qPCR results showing the levels of PKG1α and PKG1β after PKG1β silencing. One-sample t-tests were conducted. n = 3 for each group. (G) Percentages of S-phase cells treated with control or PKG1α siRNA and 2.5 μM MP-10. A Welch’s ANOVA with Dunnett’s T3 multiple comparisons test was applied. n = 4 for each group. (H) Percentages of S-phase cells treated with PKG1β siRNA and 2.5 μM MP-10. A Welch’s ANOVA with Dunnett’s T3 multiple comparisons test was applied. n = 3 for each group. All data are shown as mean ± SEM. ns, not significant.

