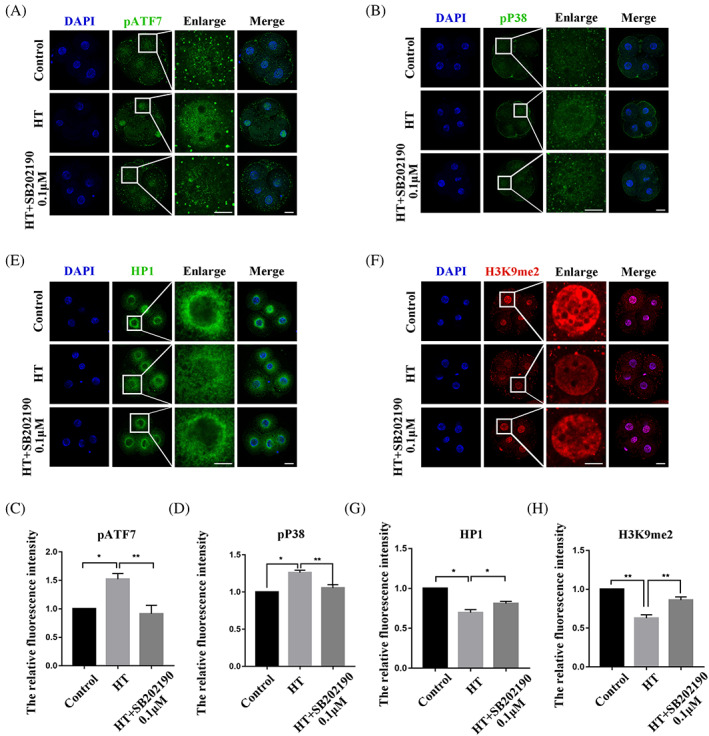
FIGURE 6.

Effects of inhibition of P38 on HT embryonic heterochromatin. (A) Typical pictures of pATF7 intensity in the 4C stage after HT exposure at 39.5°C and treatment with inhibitor SB202190 at 0.1 μM. Blue, DAPI; green, pATF7. (B) Typical pictures of pP38 intensity in the 4C stage after HT exposure at 39.5°C and treatment with inhibitor SB202190 at 0.1 μM. Blue, DAPI; green, pP38. (C,D) Fluorescence intensity of pATF7 and pP38 in the 4C stage after HT exposure at 39.5°C and treatment with SB202190 at 0.1 μM. The relative fluorescence intensity of pATF7 and pP38 in the 4C stage in the HT group compared with the control group. The relative fluorescence intensity of pATF7 and pP38 were significantly higher in the HT + SB202190 0.1 μM group compared with the HT group. *p < 0.05; **p < 0.01. (E) Typical pictures of HP1 intensity in the 4C stage after HT exposure at 39.5°C and treatment with SB202190 at 0.1 μM. Blue, DAPI; green, HP1. (F) Typical pictures of H3K9me2 intensity in the 4C stage after HT exposure at 39.5°C and treatment with SB202190 at 0.1 μM. Blue, DAPI; green, H3K9me2. (G,H) Fluorescence intensity of HP1 and H3K9me2 in the 4C stage after HT exposure at 39.5°C and treatment with SB202190 at 0.1 μM. The relative fluorescence intensity of HP1 and H3K9me2 in the 4C stage in the HT group were significantly lower compared with the control group and were significantly higher in the HT + SB202190 0.1 μM group compared with the HT group. *p < 0.05; **p < 0.01
