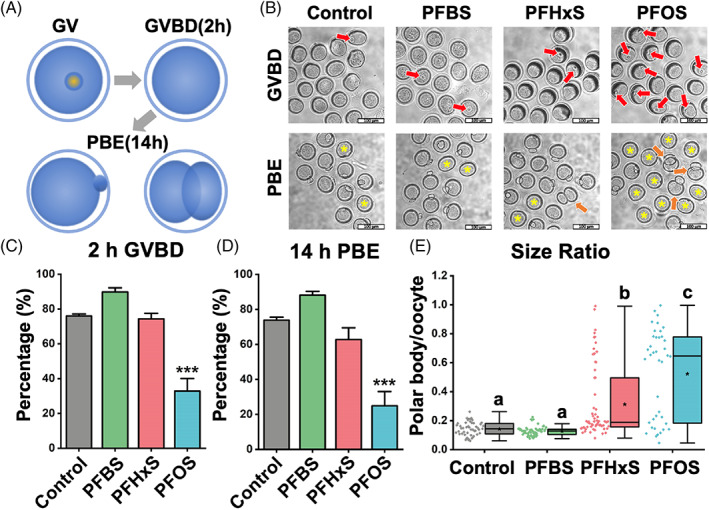
FIGURE 1.

PFSA impedes mouse oocyte maturation in a carbon‐chain‐length‐dependent manner. (A) Scheme of mouse oocyte in vitro maturation process. We examined GVBD at 2 h and PBE at 14 h. The bottom‐right image illustrates an extrusion of an abnormal large PB. (B) Representative images show GVBD and PBE of four treatment groups (untreated, 600 μM PFBS, 600 μM PFHxS, and 600 μM PFOS). The red arrows indicate oocytes that retained their germinal vesicles after 2 hours of culture. The yellow asterisks indicate oocytes that did not extrude a PB after 14 hours of culture. Orange arrows highlight oocytes with large PBs. Scale bar: 100 μm. (C) The rates of GVBD in the control and PFSA‐treated groups. (D) The rates of PBE in the control and PFSA‐treated groups. A total of 136 oocytes in the control group, 116 oocytes in the PFBS‐treated group, 179 oocytes in the PFHxS‐treated group, and 188 oocytes in the PFOS‐treated group were analyzed to calculate the GVBD and PBE rates. (E) The size ratios of PBs to oocytes in the control and PFSA‐treated groups. A total of 49 oocytes in the control group, 57 oocytes in the PFBS‐treated group, 63 oocytes in the PFHxS‐treated group, and 40 oocytes in the PFOS‐treated group were measured to calculate the size ratios. Data in bar chart were presented as mean ± SEM. All groups had at least three independent groups. ***p < 0.001, compared with control. Groups with different letters in the box plot have significant differences.
