FIGURE 3.

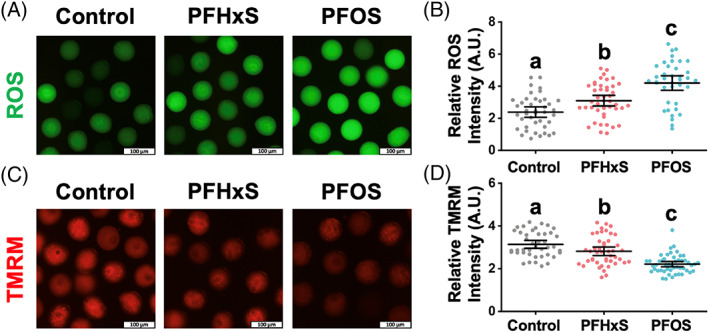
PFHxS and PFOS (600 μM) increased ROS level and reduced mitochondria membrane potential (MMP). (A) Intracellular reactive oxygen species (ROS) levels indicated by the intensity of green DCF fluorescence signal. (B) Quantitative analysis of the ROS levels in the control, PFHxS‐ and PFOS‐treated groups. A total of 41 oocytes in the control, 44 oocytes in the PFHxS‐treated group, and 38 oocytes in the PFOS‐treated group were measured under the same camera setting. (C) MMP indicated by red TMRM intensity levels. (D) Quantitative analysis of the MMP in different treatment groups. A total of 42 oocytes in the control, 45 oocytes in the PFHxS‐treated group, and 49 oocytes in the PFOS‐treated group were measured. Groups with different letters in (B) and (D) are significantly different (p < 0.05). Scale bar: 100 μm.
