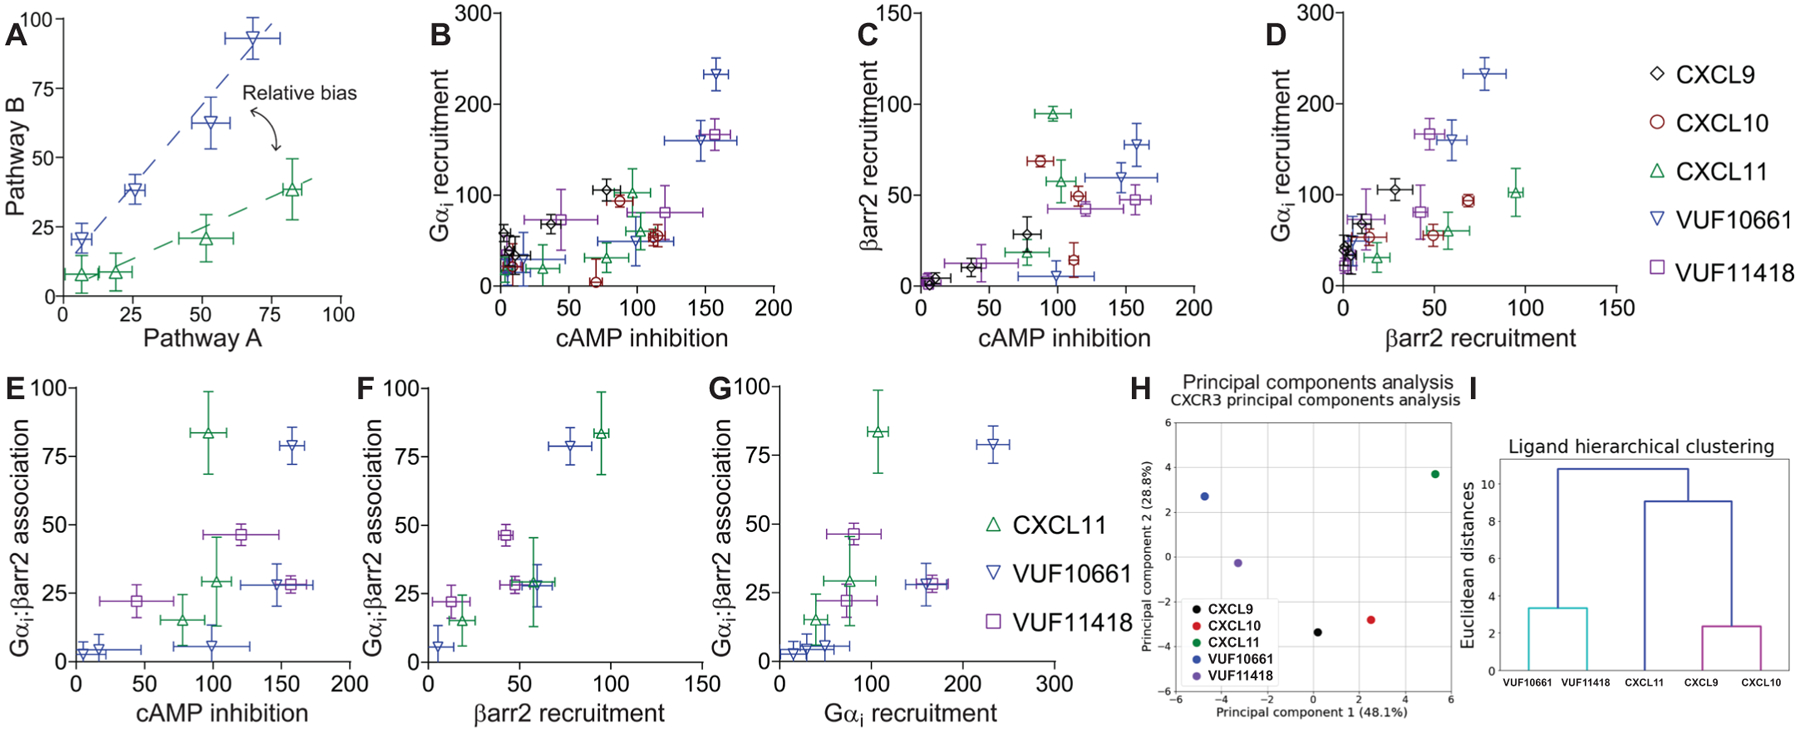
Fig. 3. Bias plots of biased ligands of CXCR3 in G protein recruitment, G protein signaling, β-arrestin2 recruitment, and Gαi:β-arrestin2 complex formation.

(A) Example of the interpretation of a bias plot. A difference in the two response-response curves (at the same agonist concentration) is indicative of a relative bias between agonists. (B to G) Bias plots of cAMP inhibition and Gαi recruitment (B); cAMP inhibition and β-arrestin2 recruitment (C); β-arrestin2 recruitment and Gαi recruitment (D); cAMP inhibition and Gαi:β-arrestin2 association, β-arrestin2 recruitment, and Gαi:β-arrestin association (F); and Gαi recruitment and Gαi:β-arrestin association (G). Because CXCL11 is the only full endogenous agonist for both the G protein and β-arrestin pathways, it was used as the reference ligand. (H) PCA was used to assess CXCR3 agonist similarity based on signaling assays; computed principal components are visualized with the top two principal components. Principal component 1 contributes to 48% of the observed variation, and principal component 2 contributes to 29% of observed variation. Points denote the composite response of a single ligand at varying concentrations. (I) Dendrogram of hierarchical clustering to determine the number of clusters and the relationship between the ligand signaling profiles. PCA and dendrogram analyses were of means from three to five independent experiments for each signaling assay.
