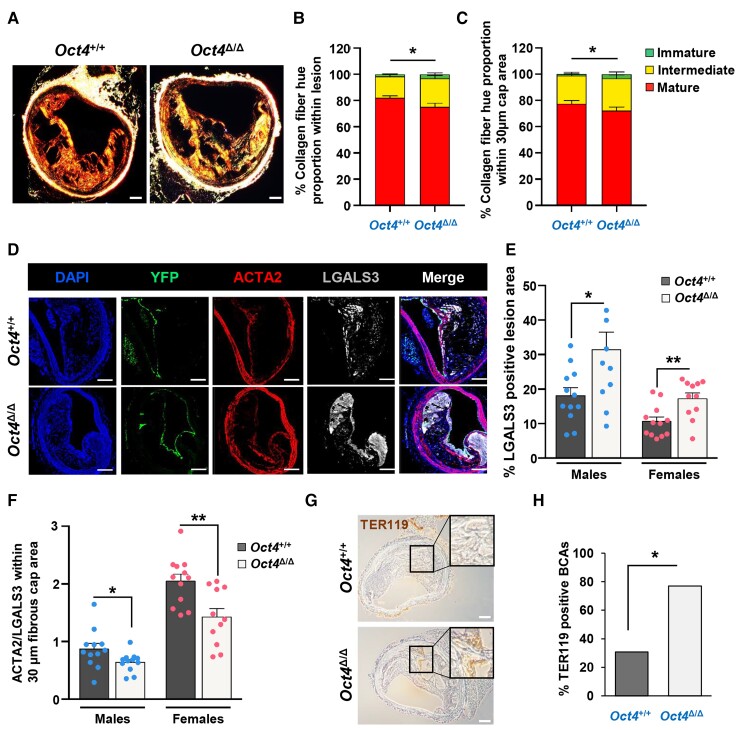
Figure 2.
EC-specific conditional knockout of Oct4 destabilizes atherosclerotic plaque. (A–C) Assessment of collagen fibre hue variations based on PicroSirius Red staining followed by polarized microscopy. (A) PicroSirius Red staining of representative BCA cross-sections of Oct4Δ/Δ and Oct4+/+ male mice fed WD for 18 weeks. Scale bar = 100 µm. The ratio between the amount of immature (green), intermediate (yellow), and mature (red) collagen fibrils showed a significant decrease in mature fibrils within the lesion (B) and the 30 µm fibrous cap area (C) of Oct4Δ/Δ mice (n = 13) as compared with control mice (n = 14), ±S.E.M.. *P < 0.05 (for mature fibrils) by unpaired Student t-test. (D) Immunofluorescence staining of DAPI, YFP, ACTA2, and LGALS3 on representative BCA sections of Oct4+/+ and Oct4Δ/Δ mice fed WD for 18 weeks, showing a noticeable increase in LGALS3+ cells in the lesion. Scale bar = 100 µm. (E and F) Quantification of the percentages of LGALS3+ lesion area (E) and the ratio of ACTA2+ cells over LGALS3+ cells within the 30 µm protective fibrous cap area (F) of BCAs collected from Oct4Δ/Δ and Oct4+/+ male and female mice after 18 weeks of WD feeding. Values = mean ± S.E.M., *P < 0.05 determined by either unpaired t-test with Welch correction (E) or unpaired t-test (F) for Oct4+/+ (n = 12 males; 12 females) vs. Oct4Δ/Δ (n = 12 males; 11 females) mice. (G) Immunostaining for the red blood cell marker TER119. Scale bar = 100 µm. Inserts indicate magnified areas. (H) The percentage of BCAs exhibiting intraplaque haemorrhage based on TER119 staining in Oct4+/+ (n = 4/13 positive BCAs) vs. Oct4Δ/Δ (n = 10/13 positive BCAs) male mice. BCAs were analysed at 120, 420, and 720 µm distance from aortic arch. If any of these three locations had any TER119-positive staining, that animal was marked as positive for haemorrhage. *P < 0.05 by Fisher’s exact test.

