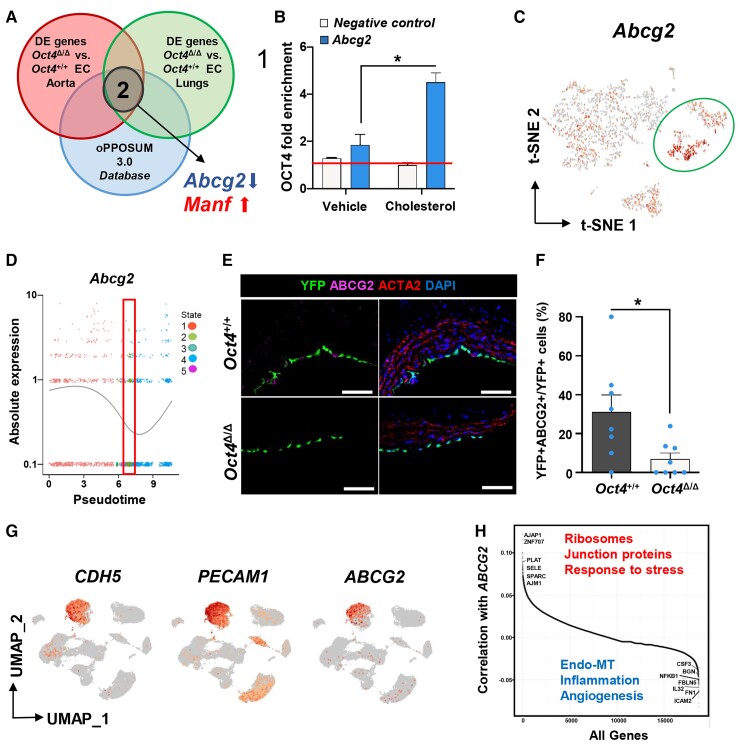
Figure 5.
Abcg2 is a direct target of OCT4 and is associated with EC phenotypic transitions in human and mouse atherosclerotic arteries. (A) Comparing in vivo aortic and lung scRNA-seq data sets with the oPPOSUM 3.0 database revealed Abcg2 and Manf1 as putative targets of OCT4. (B) ChIP analysis on cultured mouse aortic wild-type EC with or without cholesterol loading using antibodies specific for OCT4 compared with non-immune IgG (red line). Values = mean ± S.E.M.; data were analysed by unpaired t-test, n = 2 representative experiments; *P < 0.05. NC—results for the negative control loci primer set. (C) A feature plot of Abcg2 gene distribution within the scRNA-seq t-SNE map. (D) The expression level of Abcg2 in different cellular states, which has been identified by the pseudotime analysis. The red rectangle indicates State 2, unique for Oct4Δ/Δ cells, with low Abcg2 expression levels. Dots represent individual cells at each time point. The curve line represents the average of Abcg2 expression between all cells at each time point. (E) Immunostaining of YFP, ABCG2, ACTA2, and DAPI on representative BCA sections collected from 4 weeks WD-fed Oct4Δ/Δ and Oct4+/+ male mice. Scale bar = 10 µm. (F) Quantification of the percentage of YFP+ABCG2+ cells within total YFP+ cells. Values = mean ± S.E.M.. Data were analysed by non-parametric Mann–Whitney test, *P < 0.05 Oct4+/+ (n = 7) vs. Oct4Δ/Δ (n = 8) mice. (G and H) Publicly available scRNAseq data on unsorted cells from atherosclerotic human coronary arteries (Wirka et al., 2019)33 were reanalysed to trace ABCG2 expression in EC. (G) Uniform manifold approximation and projection (UMAP) visualization of cells present in human atherosclerotic arteries, showing enrichment of ABCG2 expression specifically in EC based on EC genes CDH5 and PECAM1. (H) Pairwise Pearson correlation of ABCG2 with all other genes in cells extracted from the CDH5+PECAM1+ EC cluster. Examples of the top highly correlated and anti-correlated genes and molecular pathways are indicated on the graph.

