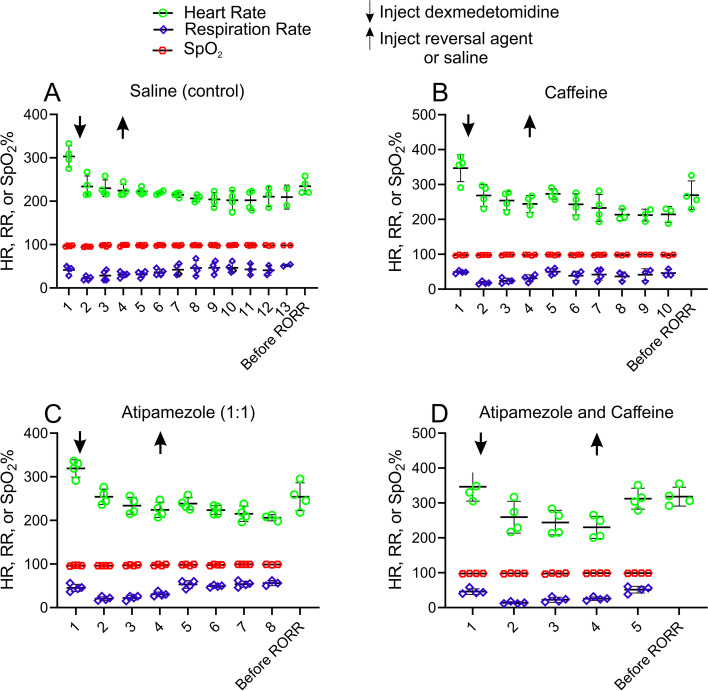
Fig. 5.
Rapid recovery of vital signs after atipamezole and caffeine (25 mg/kg). Vital sign comparisons were analyzed at different times points (1.1% isoflurane, 30 s post dexmedetomidine, 5 min post dexmedetomidine, 10 min post dexmedetomidine, 30 s post saline or reversal, 5 min post saline or reversal, 10 min post saline or reversal and before RORR) in each session using an one-way repeated measures ANOVA with Tukey’s HSD Test for multiple comparisons (n = 4). The vital signs at the time point of 1.1% isoflurane (1) was used as the control. In Fig. 5A (saline session), the HR at time point (1) was significantly different from each of those at time points (2–10) (each adjusted p < 0.05) and was not significantly different from one before RORR (adjusted p < 0.11). The RR at time point (1) was not significantly different from each of those at time points (2–10) (each adjusted p > 0.05). In Fig. 5B (caffeine session), the HR at time point (1) was significantly different from each of those at time points (2, 3, 4, 6 and 7) (each adjusted p < 0.05) and was not significantly different from those at the time point 30 s post caffeine (5) (p < 0.11) and the one before RORR (adjusted p = 0.05). The RR at time point (1) was significantly different from the one at time point 30 s post dexmedetomidine (2) (adjusted p < 0.03) and not significantly different from each of those at time points (3–7) (each adjusted p > 0.05). In Fig. 5C (atipamezole session), the HR at time point (1) was significantly different from each of those at time points (2–7) (each adjusted p < 0.05) and was not significantly different from the one before RORR (adjusted p = 0.10). The RR at time point (1) was not significantly different from each of those at time points (2–7) (each adjusted p > 0.05). In D (atipamezole and caffeine session), the HR at time point (1) was significantly different from each of those at time points (2, 3 and 4) (each adjusted p < 0.05) and was not significantly different from those at the time point 30 s post caffeine (5) (p = 0.05) and the one before RORR (adjusted p = 0.13). The RR at time point (1) was significantly different from the one at time point 30 s post dexmedetomidine (2) (adjusted p < 0.05) and not significantly different from each of those at time points (3–5) (each adjusted p > 0.05). Times to RORR varied from rats to rats in each session, (saline, 2324 ± 369 s; caffeine, 1444 ± 414 s; atipamezole, 951 ± 242 s; atipamezole with caffeine, 42 ± 8 s, n = 4). Since rats emerged at different time points within the session and between sessions, ANOVA only analyzed at the available time points without missing data in each session. Note that HR was significantly reduced after the bolus of dexmedetomidine in each session. HR before RORR returned to near the level recorded at pre-dexmedetomidine with 1.1% isoflurane in all sessions. The time point before RORR occurred much earlier in atipamezole with caffeine session (D) than those in saline (A), caffeine (B) and atipamezole (C) sessions

