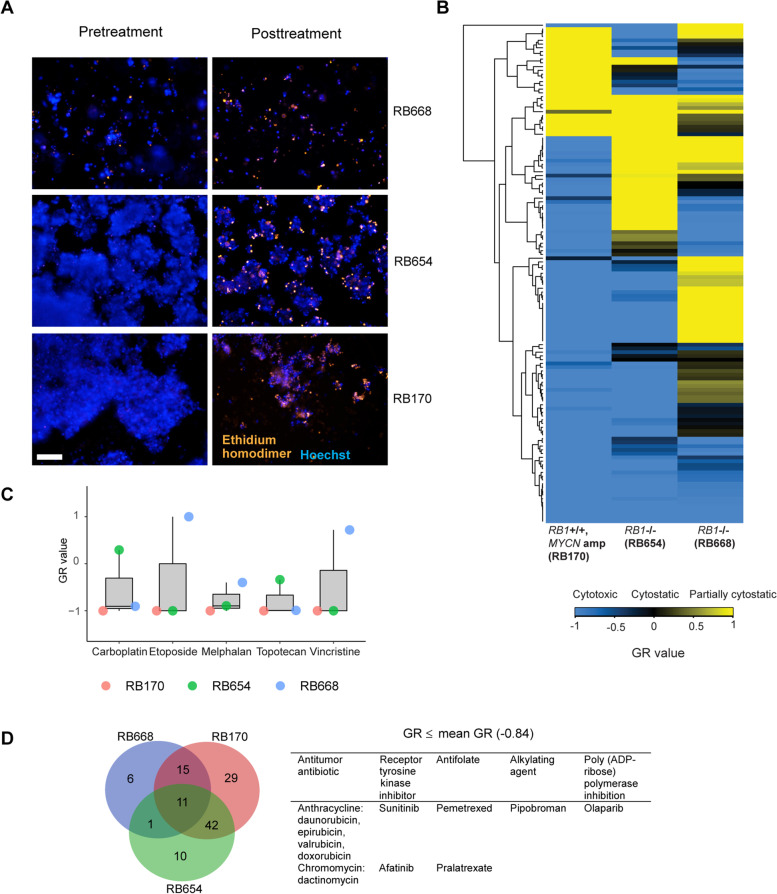
Fig. 2.
Primary screening identifies FDA-approved anticancer drugs with cytotoxicity towards RB organoids. A Representative fluorescence micrographs of organoids pre- and post-treatment with a cytotoxic drug. Hoechst (blue) stains all nuclei, whereas ethidium homodimer (orange) stains only dead cells. B Heat map of the growth rate inhibition (GR) values of single doses of drugs (10 µM) in three RB organoids. C GR values of clinically used anticancer drugs for RB. D Venn diagram of drugs with GR ≤ the mean GR value in three organoids. A total of 11 drugs inhibited the growth of all organoids. Scale bar: 100 μm (A)

