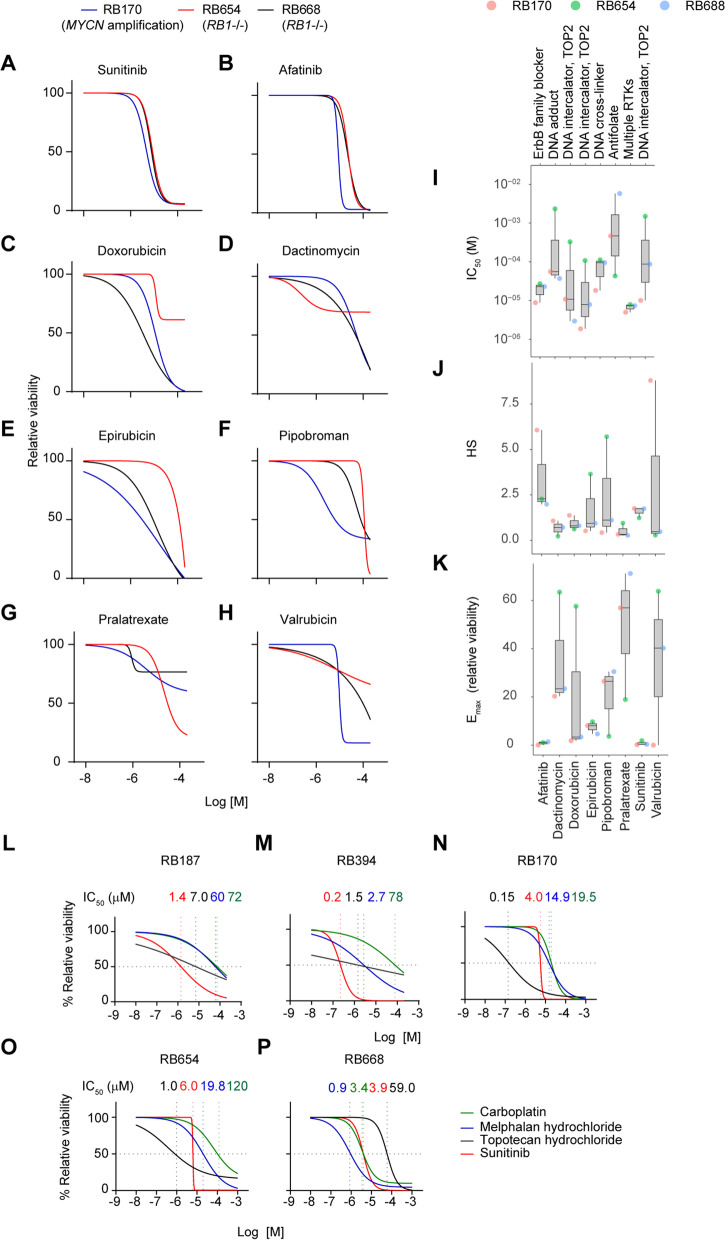
Fig. 3.
Secondary screening identifies sunitinib as a high-potency inhibitor of RB organoid growth. A–H Dose-response curves of 8 drugs tested on three organoids. I–K Data from A–H were used to calculate IC50 (I), HS (J), and Emax (K) values in the three RB organoids (colored circles). Boxes and whiskers indicate median values with interquartile ranges and variability outside the upper and lower quartiles, respectively. RTKs: receptor tyrosine kinases; TOP2: topoisomerase II. L–P Dose-response curves of sunitinib compared with the indicated drugs in five RB organoid lines

