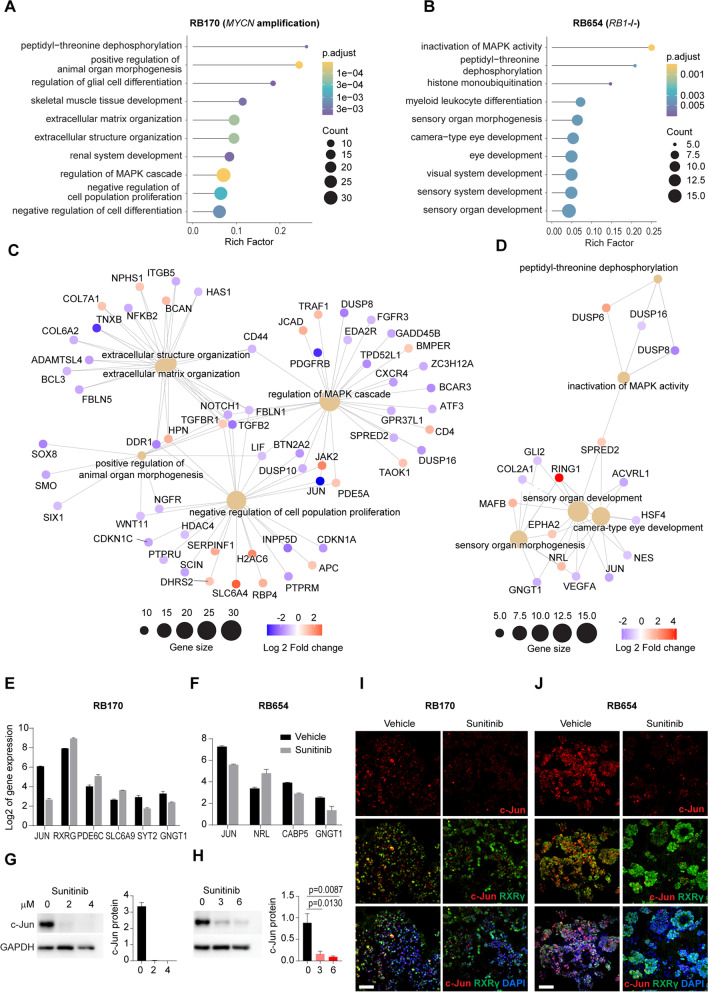
Fig. 4.
Gene Ontology (GO) analysis of the sunitinib gene signature in RB organoids. A, B The top 10 significant biological process terms enriched among differentially expressed genes (DEGs) of RB170 (A) and RB654 (B) organoids with sunitinib treatment at IC10 (2 µM and 3 µM, respectively) for 72 h. Rich factor is defined as the ratio of input DEGs with a given annotated term to all genes with that annotation. C, D Gene networks of the top five enriched GO terms after treatment of RB170 (C) and RB654 (D) organoids with sunitinib. E, F Expression of JUN and retina-associated genes from a set of DEGs from RB170 (E) and RB654 (F) organoids. G, H Protein expression of c-Jun detected by western blotting in RB170 (G) and RB654 (H) organoids treated with vehicle or sunitinib at IC10 and IC50 (4 µM and 6 µM, respectively) for 72 h. Data obtained from three independent experiments; means ± SEM are shown. I, J Representative staining of c-Jun (red), RXRG (green), and nuclei (DAPI, blue) in RB170 (I) and RB654 (J) organoids treated with vehicle or sunitinib at IC50. Image acquisition and processing was performed using the identical parameters. Scale bar: 50 μm (I, J)

