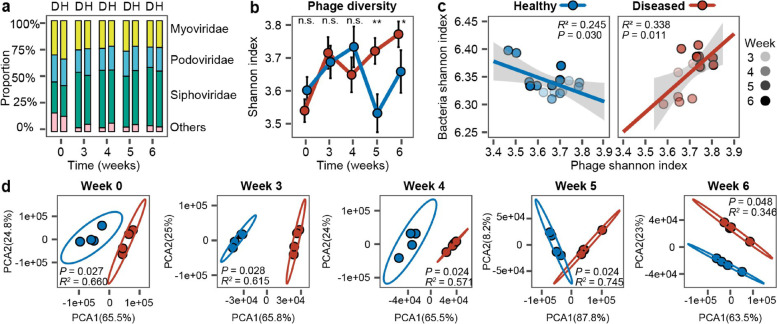
Fig. 2.
Comparison of phage community composition and diversity between healthy and diseased plant rhizosphere microbiome samples. a Comparison of relative phage abundances at the viral family level between healthy (H) and diseased (D) plant rhizosphere microbiome samples (stacked bars show the summed differences of four replicates). b Comparison of phage community diversity (Shannon alpha diversity index) between healthy and diseased rhizosphere microbiome samples based on vOTUs. Significances are shown as *P < 0.05, **P < 0.01. n.s., non-significant. One-way ANOVA for each time point (see Additional file 1: Supplementary Data S3 for details). c Linear correlations comparing Shannon diversity between bacterial and viral communities in healthy (blue circles) and diseased (red circles) plant rhizosphere microbiomes from weeks 3 to 6. d Comparison of viral community composition between healthy (blue circles) and diseased (red circles) plant rhizosphere microbiomes at different sampling time points based on vOTUs (PCA; pairwise comparisons based on PERMANOVA). In all panels, data shows four biological replicates per healthy and diseased plant group

