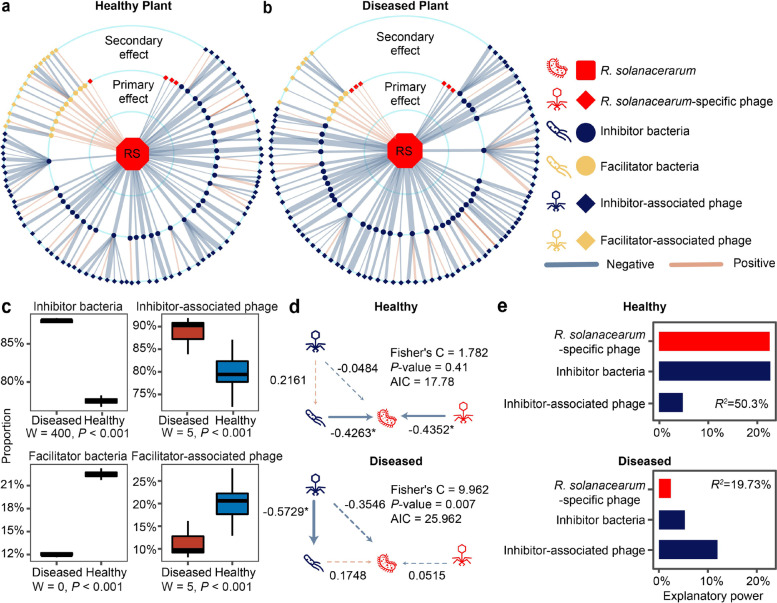
Fig. 4.
Community co-occurrence model showing correlations between R. solanacearum, bacteria and phages in healthy and diseased plant rhizosphere microbiome samples. a, b Radial co-occurrence networks showing significant correlations between R. solanacearum (RS; middle), inhibitor (blue circles) and facilitator (beige circles) bacteria and ‘R. solanacearum-specific’ phages (red diamond) and ‘inhibitor-associated’ (blue diamonds) or ‘facilitator-associated’ (beige diamonds) phages. Light blue and light brown lines denote negative and positive correlations, respectively, while line thickness represents the absolute sparcc-cov-values (Additional file 1: Supplementary Data S5). c Comparison of the proportion of different ‘functional groups’ between healthy (blue) and diseased (red) rhizosphere microbiome samples (n = 4, statistical analysis based on Wilcoxon non-parametric test). d Structural equation model illustrating significant links between R. solanacearum, ‘inhibitor bacteria’, ‘inhibitor-associated phages’ and ‘R. solanacearum phages’ in healthy and diseased plant rhizosphere samples. e The partition of explanatory power of linear models predicting R. solanacearum densities with ‘R. solanacearum phages’, ‘inhibitor bacteria’ and ‘inhibitor-associated phages’ in healthy and diseased plant rhizosphere microbiome samples (R2 shows the total variance explained by the linear models)

