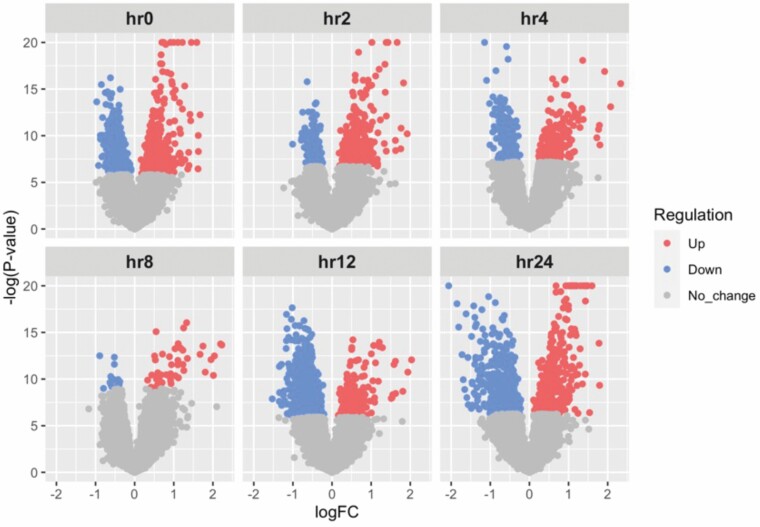
Figure 2.
Volcano plots of differential expression analysis between ≥20% TBSA and <20% TBSA patients. Using an FDR cutoff of 0.1, differential expression analysis identified 1505, 613, 380, 63, 1357, and 954 differentially regulated genes at hours 0, 2, 4, 8, 12, and 24 respectively. FDR, false-discovery rate.

