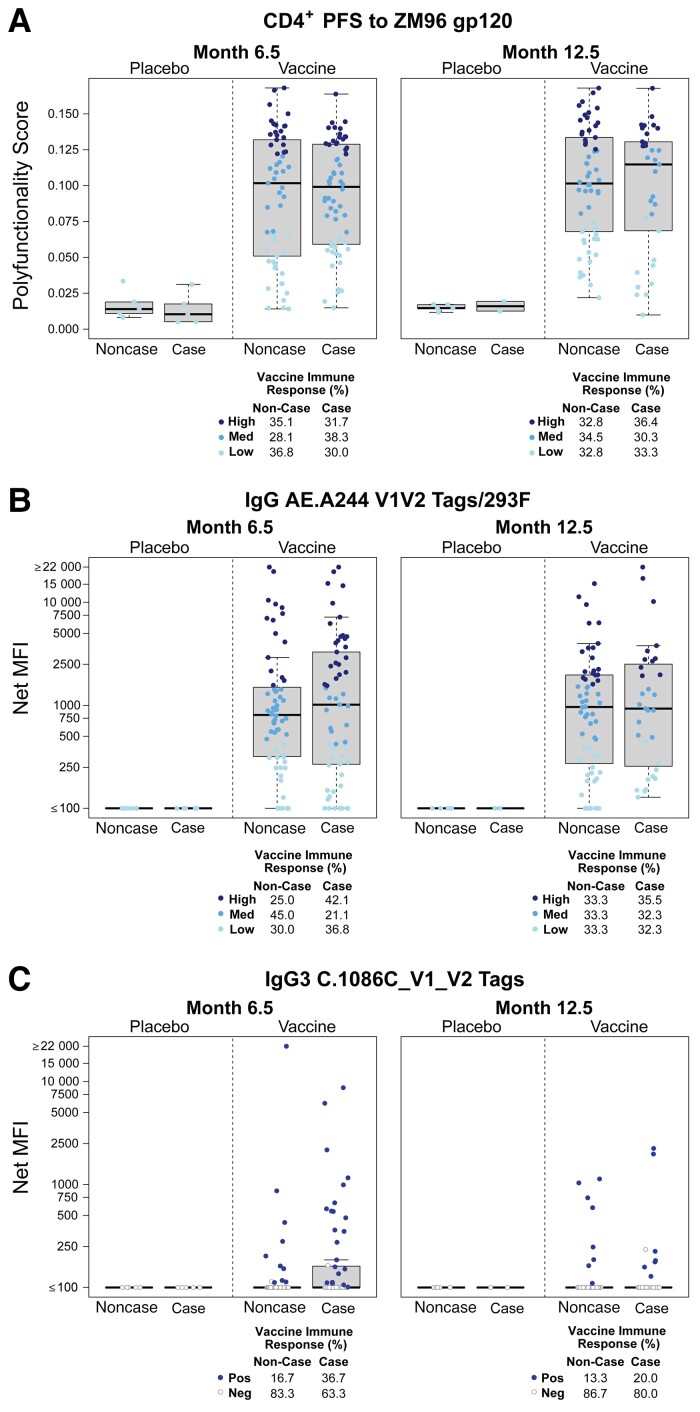
Figure 2.
Distribution of primary immune response variables. Boxplots show the primary immune response variable distributions by HIV-1 acquisition status and treatment group: (A) CD4+ polyfunctionality score to ZM96; (B) IgG binding antibody response to A244 V1V2; and (C) IgG3 binding antibody response to 1086 V1V2. A, Month 6.5 polyfunctionality score categories were, high, ≥0.121; med, 0.067 to <0.121; low, <0.067. Month 12.5 polyfunctionality score categories were high, ≥0.125; med, 0.080 to <0.125; low, <0.080. B, The positive response rates were 88% at month 6.5 and 90.1% at month 12.5. Month 6.5 binding antibody categories were high, ≥1498.83 MFI; med, 421.08 to <1498.83 MFI; low, <421.08 MFI. Month 12.5 binding antibody categories were, high, ≥1603.5 MFI; med, 468.25 to <1603.5 MFI; low, <468.25 MFI. The mid-line of the box denotes the median and the ends of the box denote the 25th and 75th percentiles. The whiskers that extend from the top and bottom of the box extend to the most extreme data points that are no more than 1.5 times the interquartile range or if no value meets this criterion, to the data extremes. Abbreviations: HIV-1, human immunodeficiency virus 1; IgG, immunoglobulin G; Med, medium; MFI, mean fluorescence intensity; Neg, negative; PFS, polyfunctionality score; Pos, positive.

