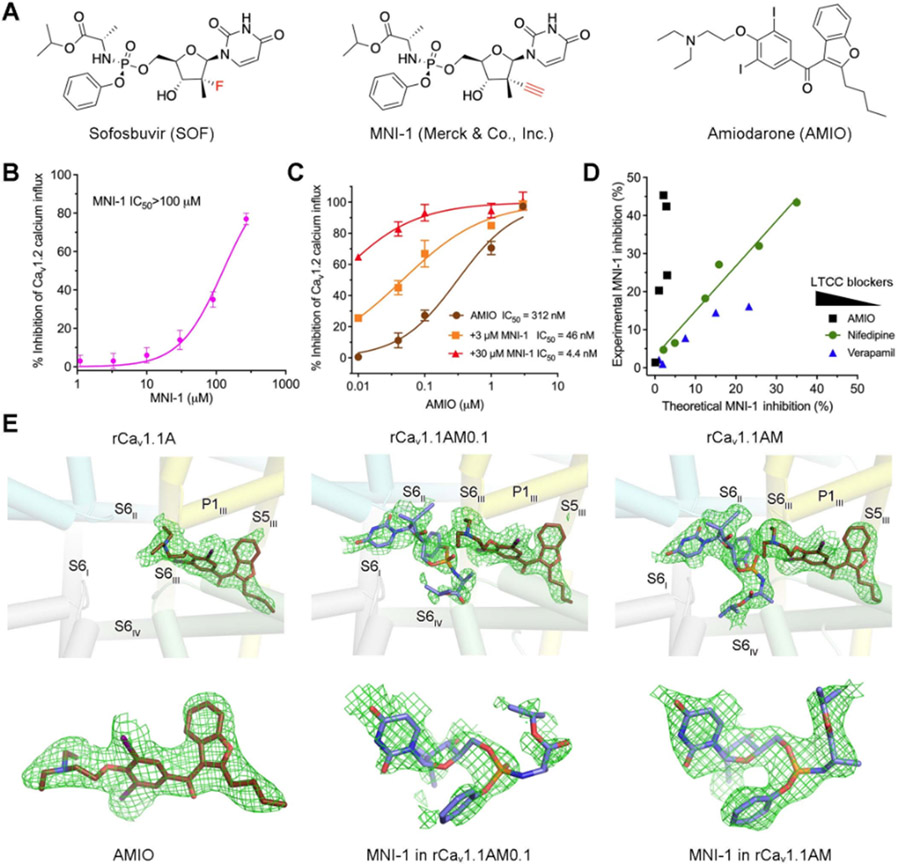
Figure 1 ∣. Cryo-EM analysis of rabbit Cav1.1 in the presence of AMIO and MNI-1.
(A) Chemical structures of sofosbuvir (SOF), MNI-1, and amiodarone (AMIO). (B) MNI-1 exhibits incomplete inhibition of Cav1.2 when applied at high concentrations. IC50 of MNI-1 was measured by Cav1.2 calcium influx assay. Values were normalized to the average response by 0.1 μM isradipine (as 100% inhibition). IC50 curves of all the figures were generated by Graphpad Prism 9. Points represent mean ± SEM obtained from at least three independent experiments performed in quadruplicate. (C) Synergistic effect of AMIO on MNI-1. IC50 values were calculated using MNI-1 as baseline. (D) Modeling of pharmacodynamic effects of LTCC blockers on MNI-1. This figure was plotted from a batch of IC50 experiment measuring LTCC blockers supplemented with 3 μM MNI-1 (AMIO), or 90 μM MNI-1 (nifedipine and verapamil). Please refer to STAR★Methods for detailed explanation of the modeling. The concentrations of LTCC blockers decrease from left to right. (E) EM densities of the bound ligands. Top: The ligand densities in the pore domain (PD) of rabbit Cav1.1 in the presence of the indicated chemicals. rCav1.1A: rabbit Cav1.1 implemented with 0.1 mM AMIO; rCav1.1AM0.1: with 0.1 mM AMIO and 0.1 mM MNI-1; rCav1.1AM: with 0.1 mM AMIO and 1 mM MNI-1. The domain coloured PD is shown as semi-transparent cylindrical cartoon. Bottom: Enlarged views of the EM densities for the indicated ligands. All the densities, shown as green meshes, are contoured at 4 σ. All structure figures are prepared in PyMol (DeLano, 2002). See also Figures S1, S2.

