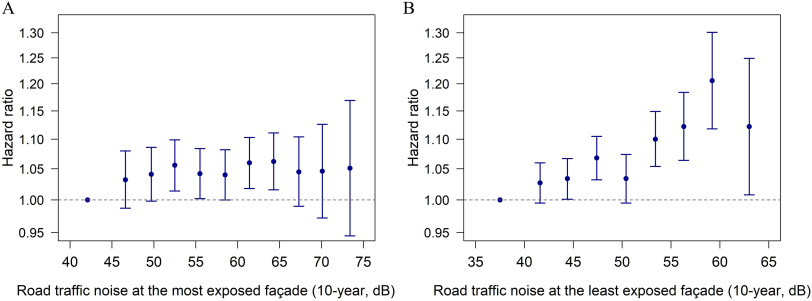
Figure 1.
Associations between 10-y mean exposure to road traffic noise at the most (A) and least (B) exposed façades and risk of tinnitus using the fully adjusted model. The vertical bars show hazard ratios with 95% confidence interval at the median of the exposure categories compared with the reference category. Reference category was for and for . Risk estimates and number of cases for each exposure category are shown in Table S3.

