. 2023 Feb 1;131(2):027001. doi: 10.1289/EHP11248

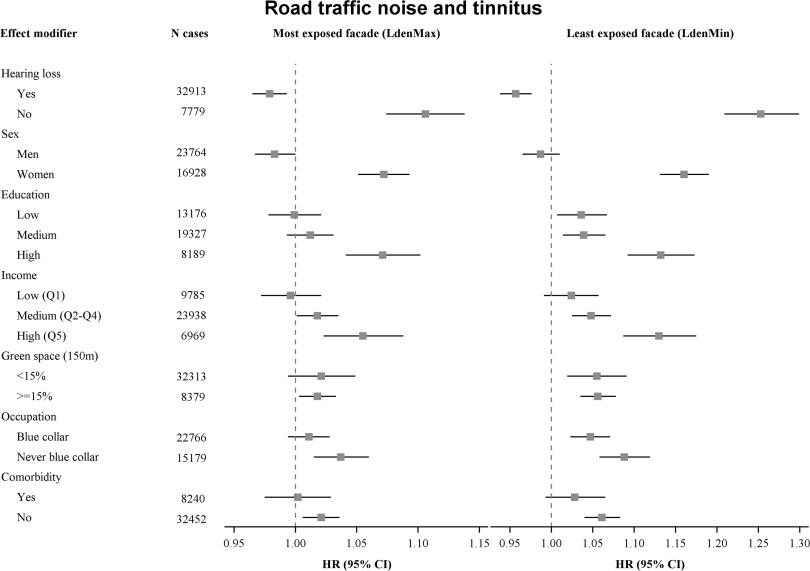
Figure 2.

Figure 2 is a set of two forest plots titled Road traffic noise and tinnitus, plotting effect modifier with number of cases (bottom to top), ranging as Comorbidity: 8240 cases under yes and 32452 cases under no; Occupation: 22766 cases under Blue collar and 15179 cases under never blue collar; Green space (150 meters): 32313 cases under less than 15 percent and 8379 cases under greater than or equal to 15 percent; Income: 9785 cases of low (Quarter 1), 23938 cases of medium (Quarter 2 to Quarter 4), and 6969 cases High (Quarter 5); Education: 13176 cases of Low, 19327 cases of Medium, and 8189 cases of High; Sex: 23764 cases of Men and 16928 cases of Women; and Hearing loss: 32913 cases of yes and 7779 cases of no (y-axis) across hazard ratios (95 percent confidence intervals), ranging from 0.95 to 1.15 in increments of 0.05 and 0.95 to 1.30 in increments of 0.05 (x-axis) for most exposed façade (level begin subscript day, evening, night end subscript maximum) and least exposed façade (level begin subscript day, evening, night end subscript minimum).

Effect modification analysis of associations between 10-y mean road traffic noise (continuous, per 10 dB, using the fully adjusted model) at the most and least exposed façade and risk of tinnitus by: hearing loss diagnosis, sex, education, income, green space (150m), occupation, and comorbidity. Risk estimates and number of cases in each modifier subgroup are shown in Table S5.