
Figure 4.
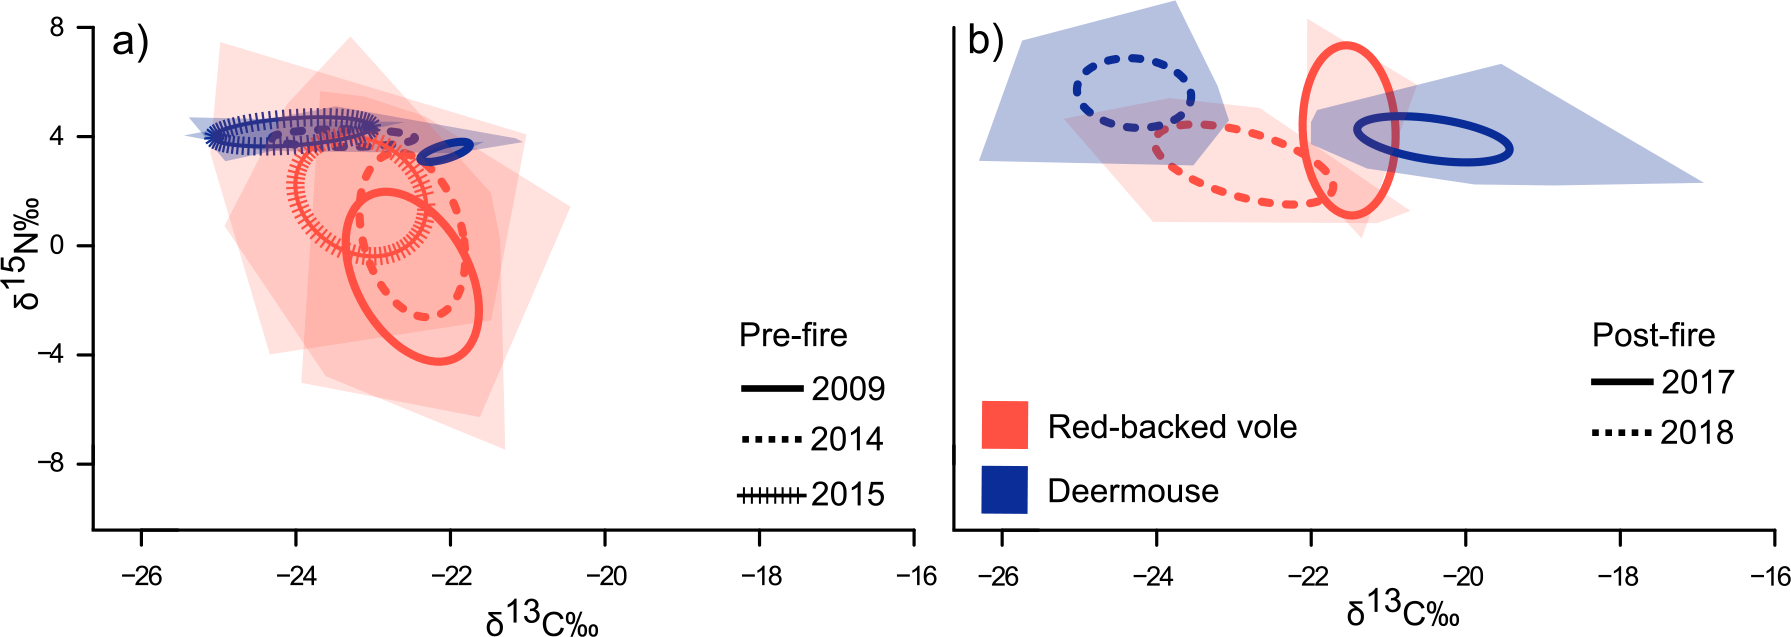
Carbon and nitrogen isotope signatures (δ13C and δ15N) of deermice and red-backed voles shift from (a) pre-fire to (b) post-fire (both axes are the same). Standard ellipses corrected for small sample size (SEAc; lines) illustrate dietary niche breadth, and convex hulls (shaded) enclose a species isotopic values within a given year. The post-fire reduction in vole population is associated with a nearly 3x increase in deermouse dietary niche.