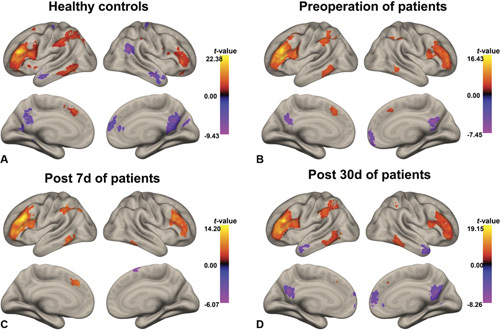
Figure 2.

Positive and negative functional connectivity (FC) maps of the left DLPFC in healthy controls and surgery patients. A, Healthy controls. B, Surgery patients at baseline. C, Surgery patients on day 7 after cardiac surgery. D, Surgery patients on day 30 after cardiac surgery. The statistical threshold was P < 0.05. Colour bar indicates the t-value. DLPFC indicates dorsolateral prefrontal cortex.
