Fig. 3.

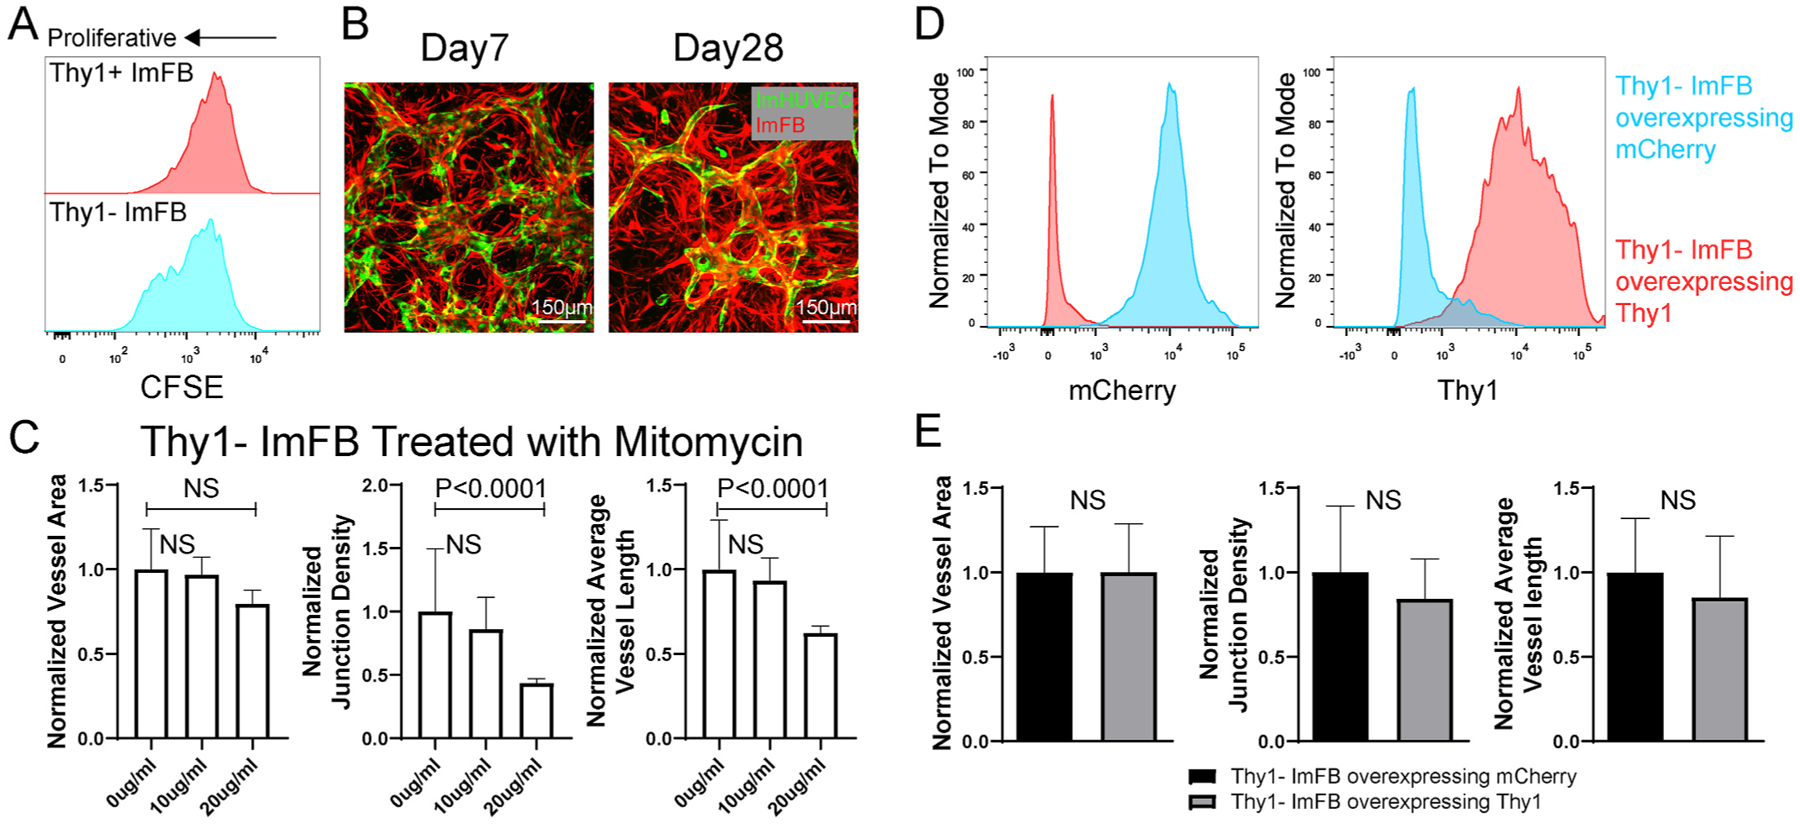
Neither over-proliferation nor decreased Thy1 causes defective μVN formation with Thy1− FBs. (A) Comparison of proliferation between Thy1+ and Thy1− ImFBs by monitoring CFSE. (B) Representative images of μVNs made of ImHUVECs with ImFBs on day 7 and day 28 (FB over-proliferation). Green, ImHUVECs. Red, ImFBs. Scale bar is 150 μm. (C) Statistical analysis of normalized vessel area (left), junction density (middle), and average vessel length (right) of μVNs formed with Thy1− ImFBs treated with 0, 10 or 20 μg/ml mitomycin C for 2.5 h before seeding. (D) Flowcytometry measurements of mCherry (left) and Thy1 (right) in Thy1− ImFBs overexpressing mCherry as control (blue), or Thy1− ImFBs overexpressing Thy1 (red). (E) Statistical analysis of normalized vessel area (left), junction density (middle), and average vessel length (right) of μVNs formed with Thy1− ImFBs overexpressing mCherry or Thy1. Bars represent mean ± SD. Two-tailed t tests were performed for the statistical comparisons.
