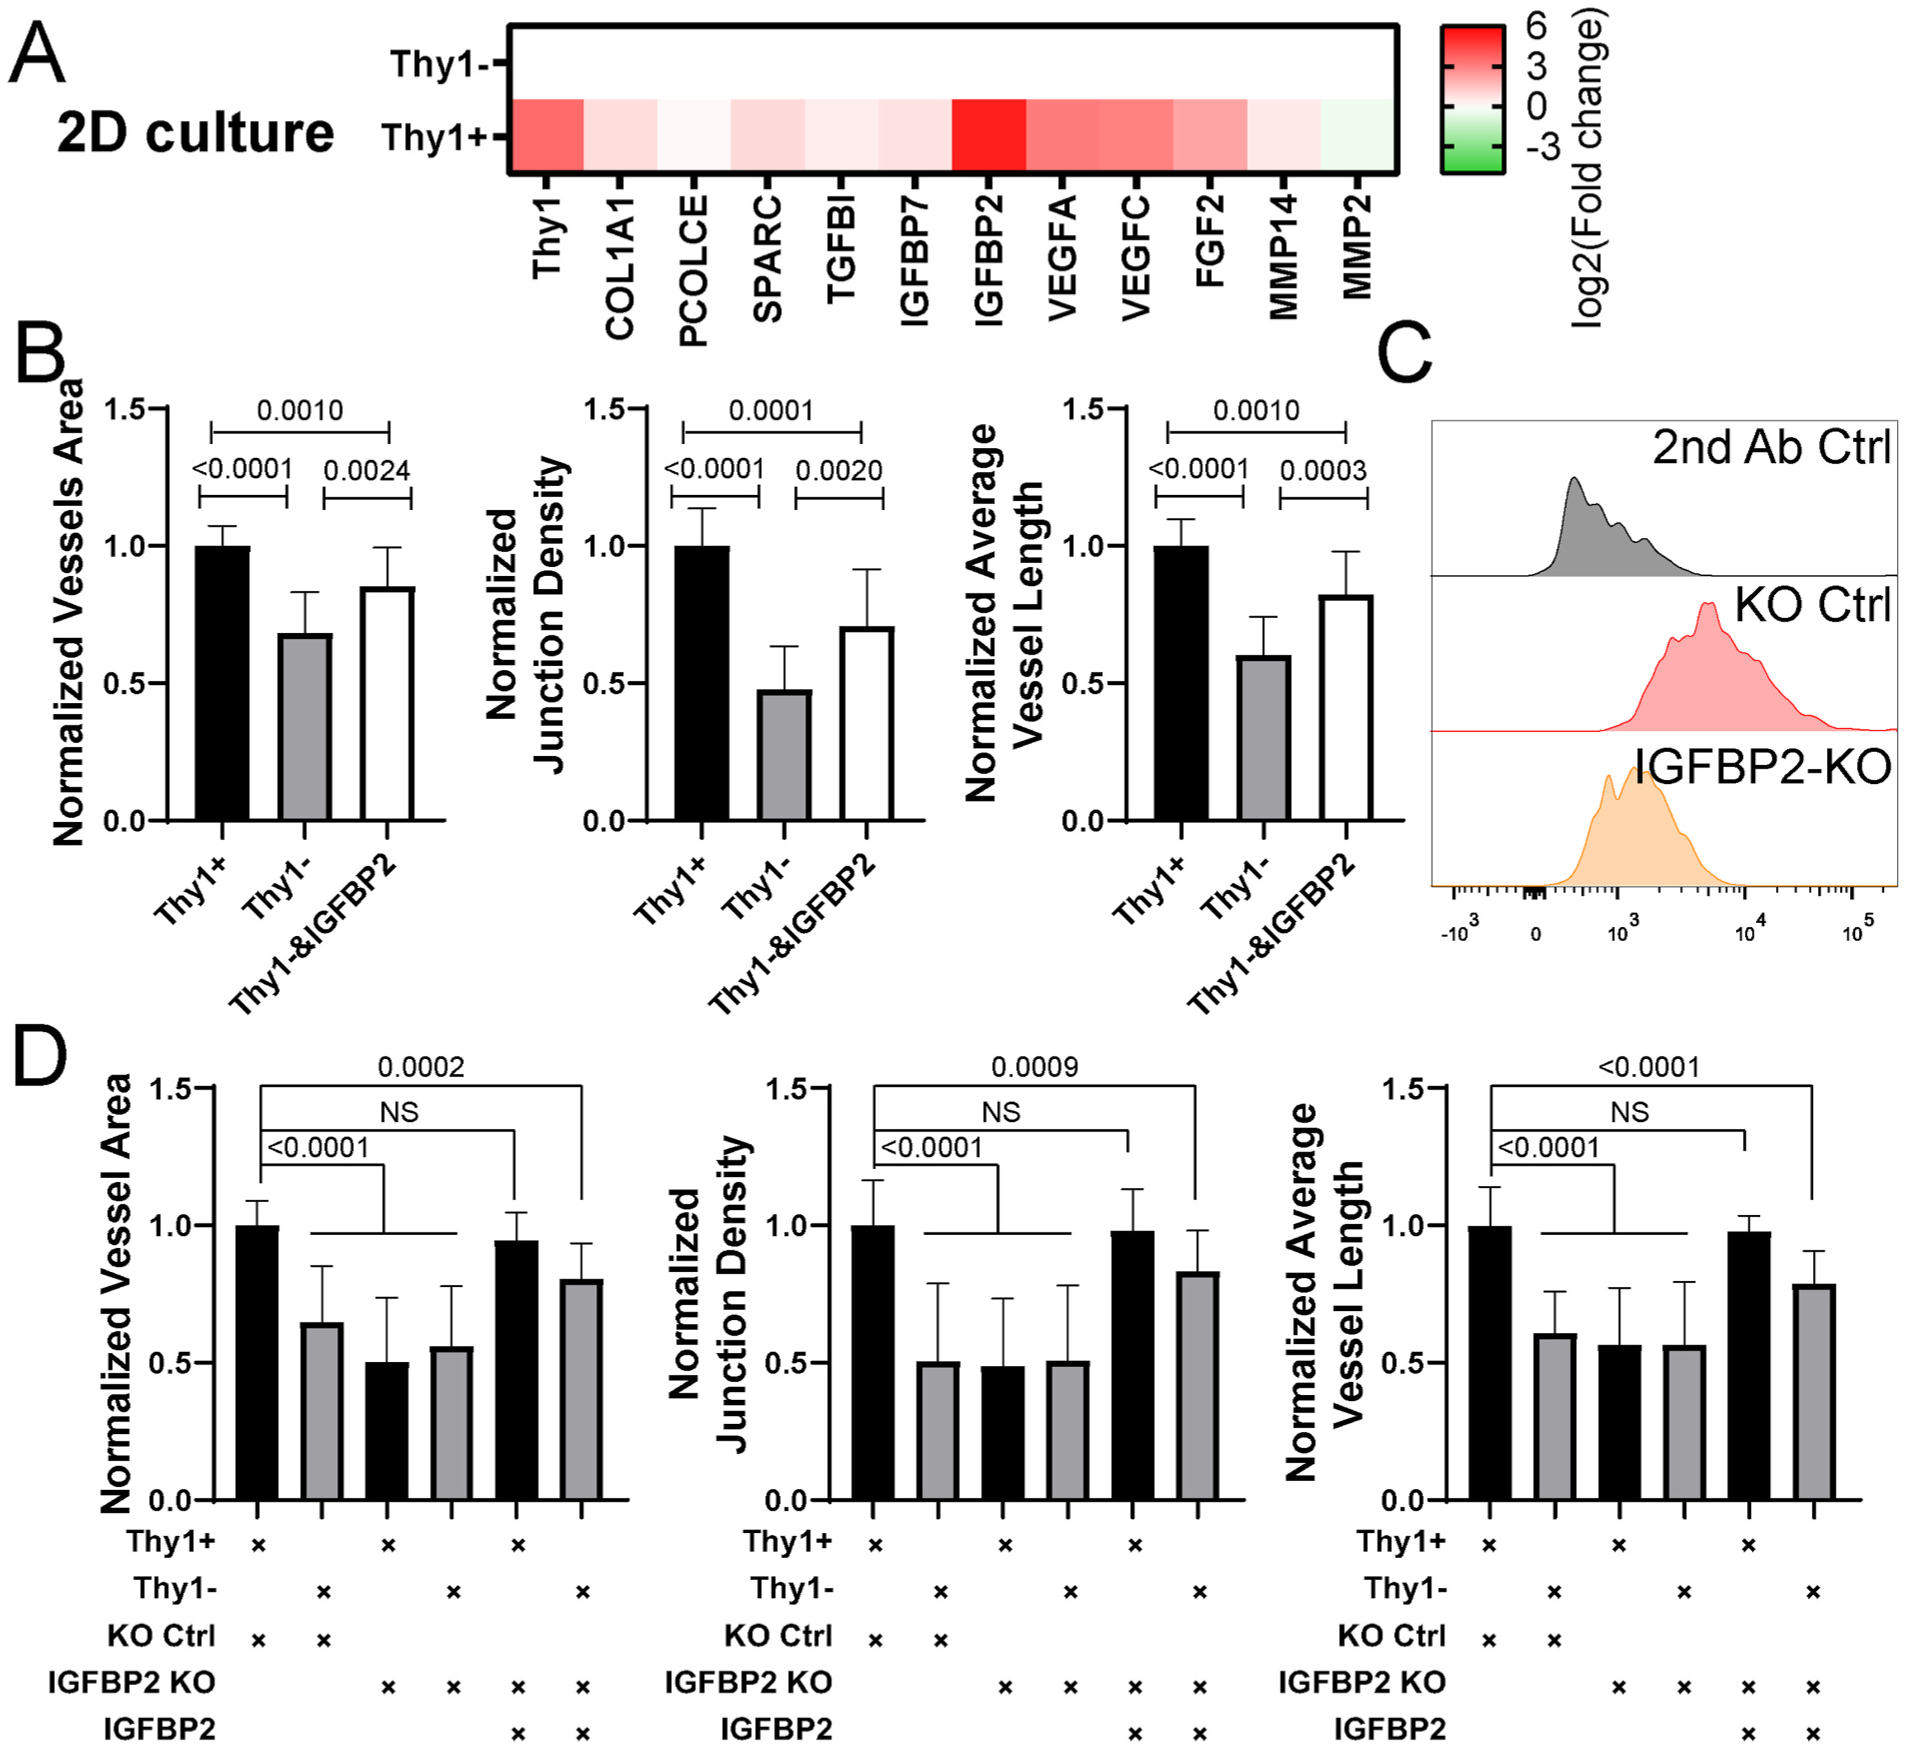
Fig. 4.

IGFBP2 partially rescues the morphological defects in μVNs formed with Thy1− FBs. (A) Heatmap of RT-PCR results of Thy1+ and Thy1− ImFB 2D monolayers. Fold change was relative to Thy1− ImFBs. (B) Normalized vessel area (left), junction density (middle), and average vessel length (right) analyses of μVNs formed with Thy1+, Thy1−, or Thy1− ImFBs supplemented with IGFBP2. (C) Representative histograms showing expression of IGFBP2 in knock out (KO) control ImFBs and IGFBP2 KO ImFBs. (D) Normalized vessel area (left), junction density (middle), and average vessel length (right) analyses of μVNs formed with Thy1+ KO control ImFBs, Thy1− KO control ImFBs, Thy1+ IGFBP2 KO ImFBs or Thy1− IGFBP2 KO ImFBs supplemented with or without IGFBP2. Bars represent mean ± SD. Two-tailed t tests were performed for the statistical comparisons.
