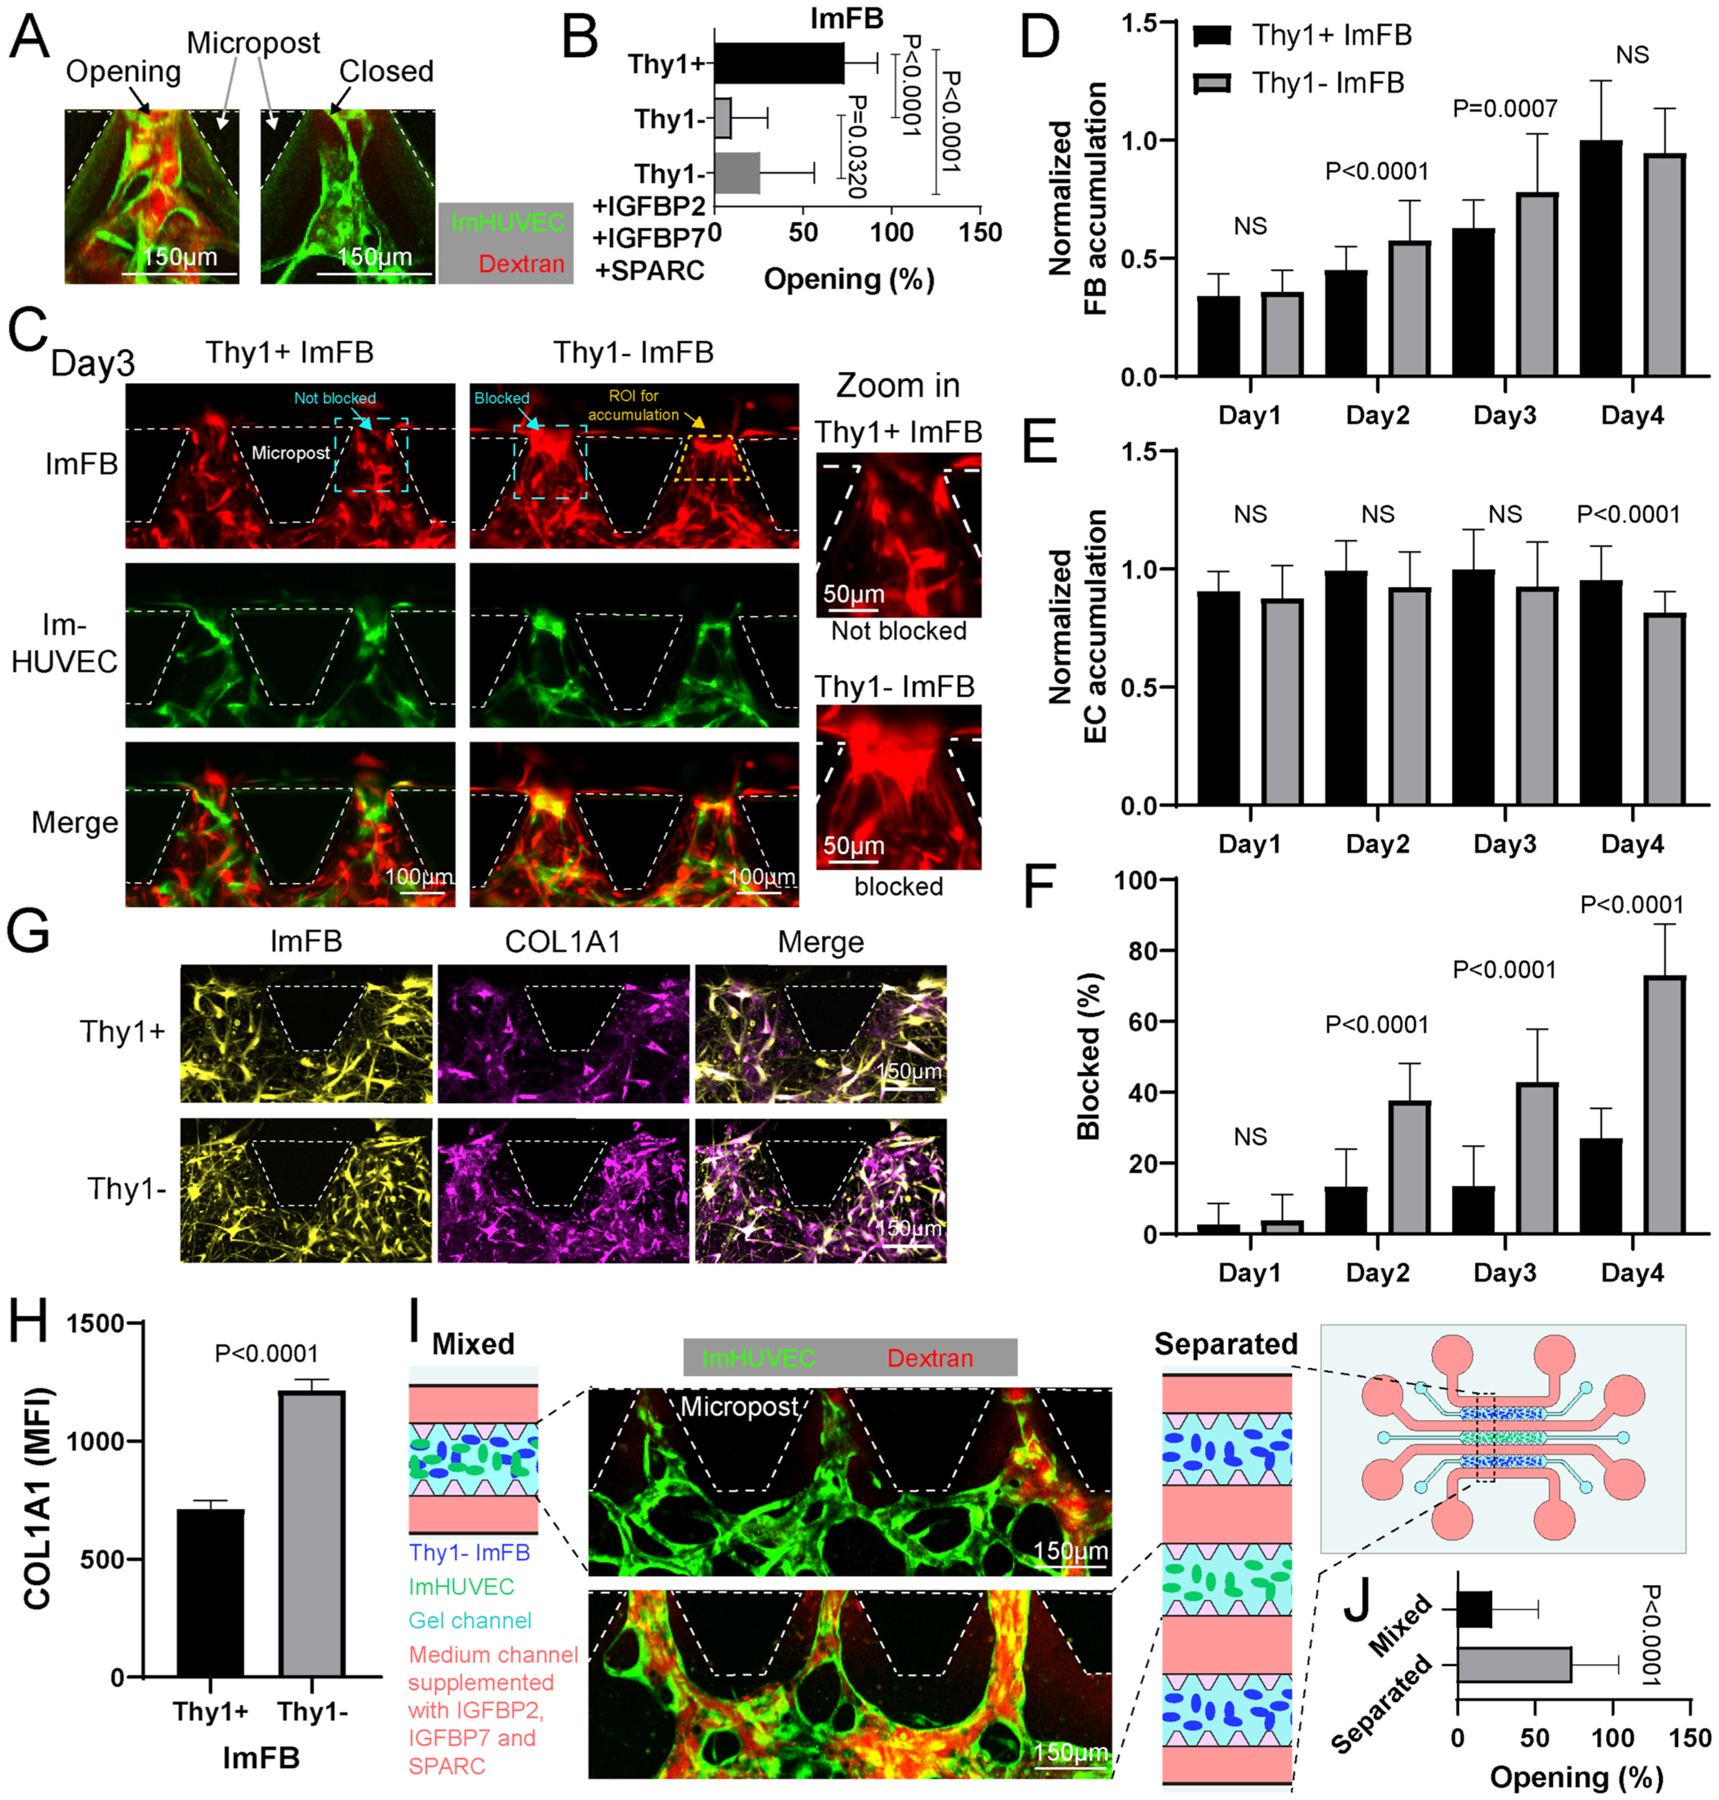
Fig. 6.

Thy1− FBs block microvessel openings and reduce μVN perfusability. (A) Representative confocal images of open and closed microvessels at the gap regions between microposts. Green, ImHUVECs. Red, dextran. (B) Percentage of microvessel openings in each region of interest. (C) Representative images of μVNs formed with Thy1+ or Thy1− ImFBs at the gap regions between microposts on day 3. Magnified images of cyan dashed squares are on the right to show the location of ImFBs forming not blocked or blocked structures. The yellow dashed line highlights the region of interest (ROI) for accumulation analysis in figure D and E. (D, E) Statistical analysis of ImFB (D) and ImHUVEC (E) accumulation at the gap regions between microposts from day 1 to day 4. (F) Percentage of blocked openings at the gap regions between microposts from day 1 to day 4. (G) Representative images of ImFBs and alpha-1 type 1 collagen (COL1A1) immunofluorescent staining in μVNs at the gap regions between microposts on day 3. (H) Statistical quantification of the mean fluorescent intensity (MFI) of COL1A1 at the gap regions between microposts on day 3. (I) Schematic diagram and representative images of the μVNs made of ImHUVECs with Thy1− ImFBs seeded in the single gel channel device (Mixed) or the 3-gel channel devices (Separated). Cells were cultured with Vasculife medium supplemented with IGFBP2, IGFBP7, and SPARC. (J) Statistical quantification of the percentage of microvessel openings at the gap region between microposts in mixed or separated devices. Bars represent mean ± SD. Two-tailed t tests were performed for the statistical comparisons.
