. 2023 Jan 9;14(5):1114–1122. doi: 10.1039/d2sc06171f

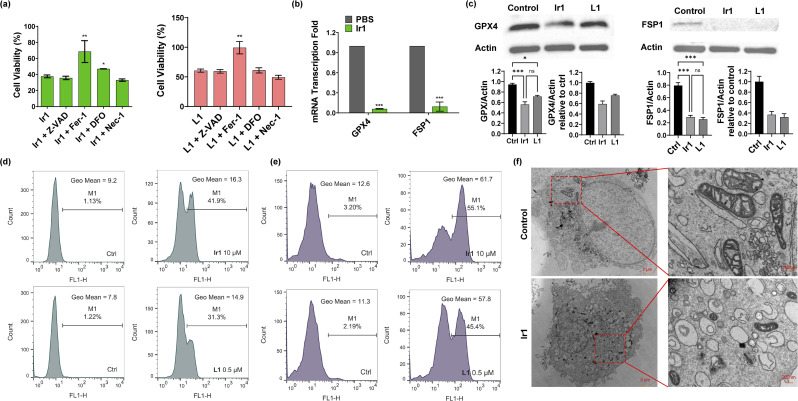
Fig. 2. Characterization of Ir1-induced ferroptosis. (a) Viability of HT1080 cells treated with 10 μM Ir1/0.5 μM L1, 10 μM Ir1/0.5 μM L1 + 20 μM Z-VAD, 10 μM Ir1/0.5 μM L1 + 2 μM Fer-1, 10 μM Ir1/0.5 μM L1 + 40 μM DFO, and 10 μM Ir1/0.5 μM L1 + 25 μM Nec-1 for 48 h. (b) Fold changes in GPX4 and FSP1 mRNA transcription in HT1080 cells treated with 10 μM Ir1 and PBS as the control. (c) Expression of GPX4 and FSP1 in Ir1-, L1-, and PBS-treated HT1080 cells by western blot. (d) Lipid peroxidation in HT1080 cells treated with 0.5 μM L1 and 10 μM Ir1 with PBS as the control, determined by BODIPY-C11 staining via flow cytometry after 3 h incubation. (e) ROS production was evaluated by DCFH-DA staining after 3 h incubation in PBS-treated and 0.5 and 10 μM L1- and Ir1-treated HT1080 cells. (f) TEM images of control (PBS) and 10 μM Ir1-treated HT1080 cells after 24 h incubation; scale bars: 2 μm (left), 200 nm (right). Values are expressed as the mean ± SD (n = 3). Statistical significance was evaluated by t test or one-way ANOVA; ns p ≥ 0.05, *p < 0.05, **p < 0.01, and ***p < 0.001.

Fig. 2