. 2023 Jan 9;14(5):1114–1122. doi: 10.1039/d2sc06171f

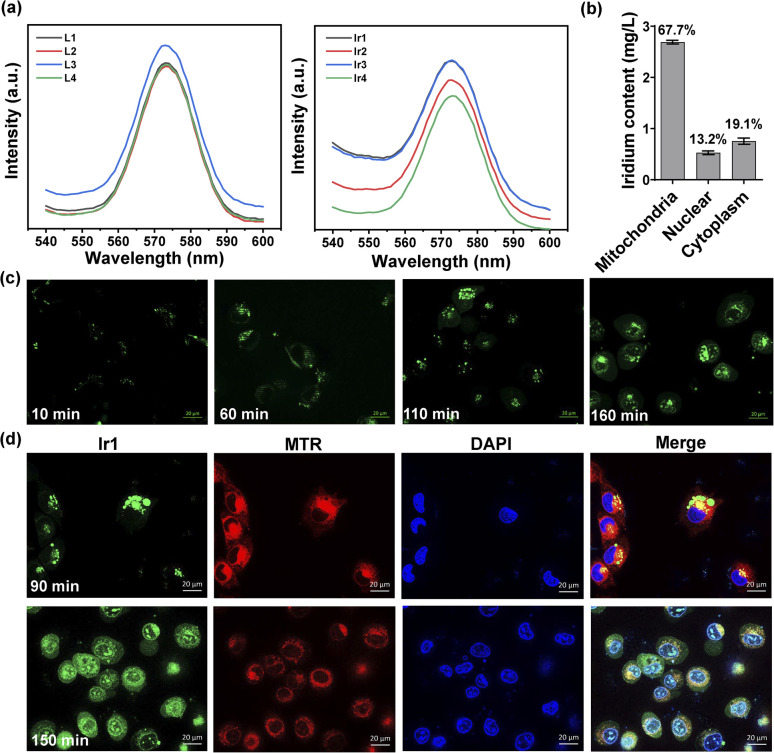
Fig. 3. Intracellular localization and organelle colocalization of Ir1 in treated HT1080 cells. (a) Fluorescence intensity of the four ligands and their corresponding Ir(iii) complexes (10 μM in dimethyl sulfoxide) under 488 nm excitation. (b) Cellular distribution of iridium in HT1080 cells measured by quantitative ICP-MS after 12 h of incubation. (c) Microscopic images of HT1080 cells at different time points after incubation with 10 μM Ir1 (λex/em = 488/575 ± 20 nm); scale bar: 20 μm. (d) Microscopic images of HT1080 cells at 90 min and 150 min after Ir1 treatment, followed by incubation with 2 μM MTR (λex/em = 572/632 ± 10 nm) and 5 μM DAPI (λex/em = 375/488 ± 10 nm); scale bar: 20 μm.

Fig. 3