. 2023 Jan 9;14(5):1114–1122. doi: 10.1039/d2sc06171f

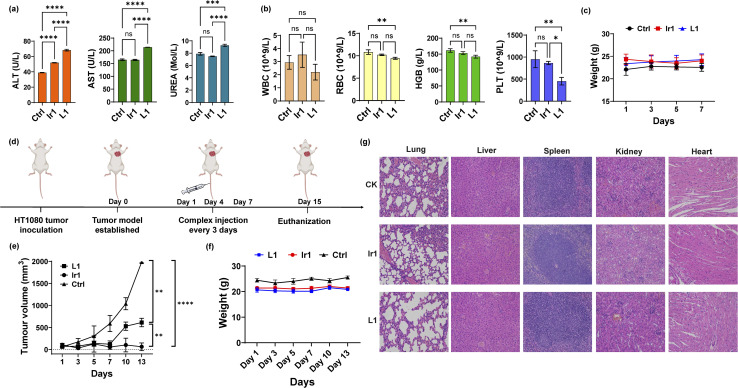
Fig. 5. In vivo toxicity and antitumor tests. (a) Biochemical analysis (ALT, AST, and UREA) and (b) haematological analysis (RBCs, WBCs, HGB, and PLT) of the blood from mice 7 days postinjection with Ir1 (5 mg kg−1), L1 (5 mg kg−1), and PBS. (c) The body weights of the mice injected with the respective compounds over 7 days. (d) Schematic diagram of the in vivo experiment. (e) The tumour volume curves and (f) mouse body weight over 13 days. (g) Haematoxylin and eosin (H&E) staining of the liver, spleen, kidney, heart, and lung tissues of the mice at 7 days postinjection. Image magnification: 200×. Values are expressed as the mean ± SD (n = 3). Statistical significance was evaluated by t test or one-way ANOVA; ns p ≥ 0.05, *p < 0.05, **p < 0.01, ***p < 0.001, and ****p < 0.0001.

Fig. 5