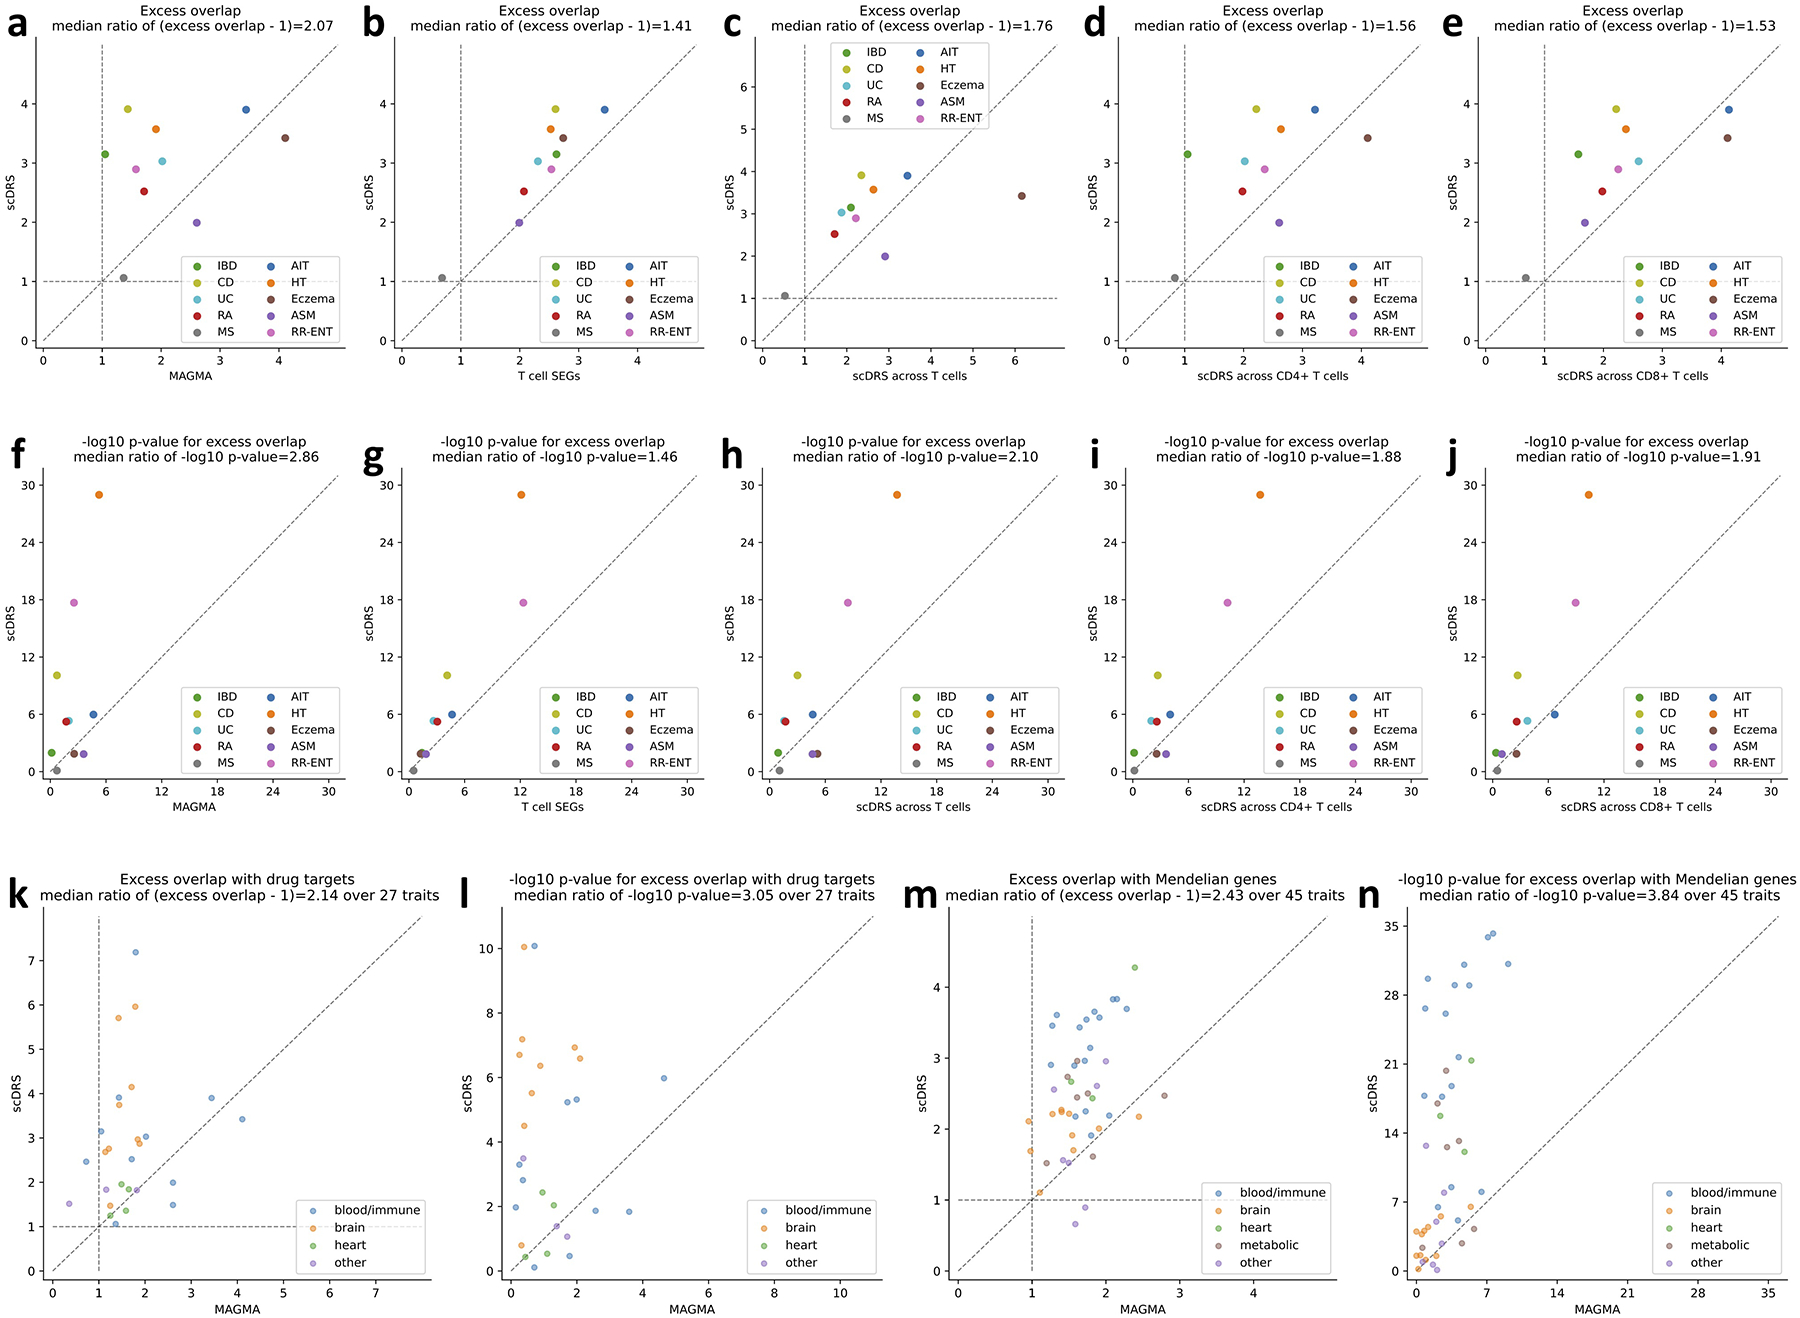
Extended Data Fig. 7. Additional results on disease gene prioritization.

(a-j) Comparison to alternative disease gene prioritization methods for the 10 autoimmune diseases. The first row shows levels of excess overlap between the prioritized disease genes and the gold standard gene sets while the second row shows the corresponding −log10 p-values for excess overlap. Each dot corresponds to a disease, the y-axis shows results for the proposed prioritization method (correlating gene expression levels with the scDRS disease score across all TMS FACS cells), and the x-axis shows results from comparison methods, including (from left to right) top 1,000 MAGMA genes, top 1,000 genes specifically expressed in T cells (vs. the rest of cells in TMS FACS), prioritization based on correlation across T cells (instead of all TMS FACS cells), prioritization based on correlation across CD4+ T cells (instead of all TMS FACS cells), and prioritization based on correlation across CD8+ T cells (instead of all TMS FACS cells). (k-l) Overlap with drug target genes for 27 diseases. (m-n) Overlap with Mendelian disease genes for 45 diseases. The median ratio of −log10 p-values and (excess overlap − 1) between the y- and x-values (median of ratios) was provided in the figure title. P-values are based on two-sided Fisher’s exact tests.
