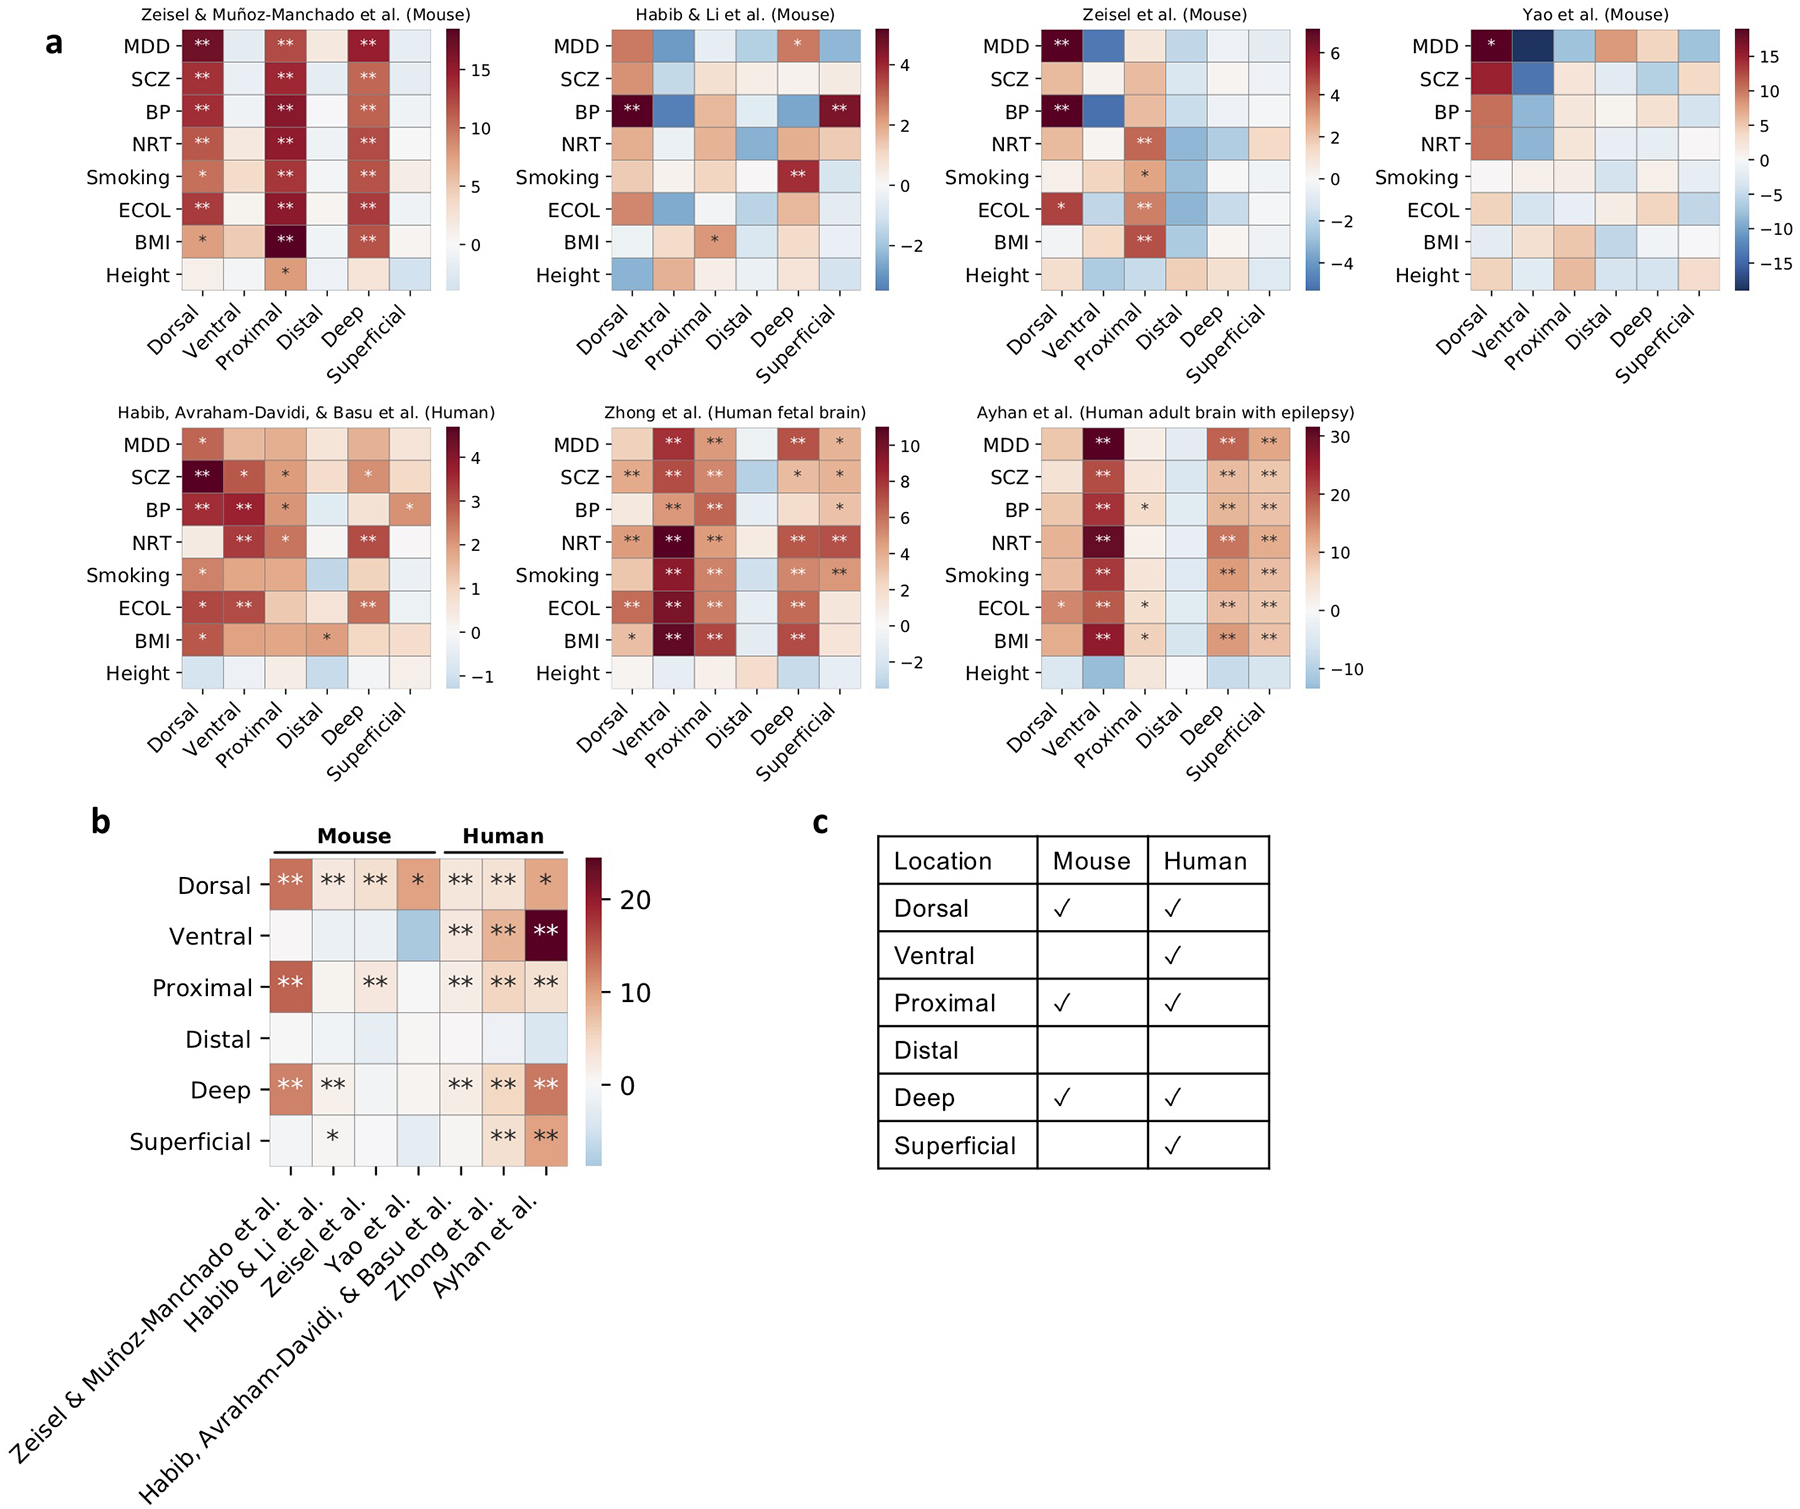
Extended Data Fig. 8. Complete results of correlations between scDRS disease scores and inferred spatial coordinates across CA1 pyramidal neurons in 7 single-cell data sets (extending results in Figure 5b).

(a) Results for regressing the scDRS disease scores against the inferred spatial coordinates for each disease/trait and each inferred spatial coordinate. Color represents the t-statistics and stars represent significant associations (* denotes P<0.05 and ** denotes P<0.005, one-sided MC test; Methods). For clarification, Zeisel & Muñoz-Manchado et al. refers to the data from Zeisel & Muñoz-Manchado et al. 2015 Science46 and Zeisel et al. refers to the data from Zeisel et al. 2018 Cell51. (b) Summary of results in panel a. Heatmap color represent the average t-statistics across the 7 brain-related diseases/traits (excluding height) for each data set and stars represent significant associations by combining p-values across datasets using Fisher’s combined probability test. (c) Summary of the association between brain-related diseases and the inferred spatial coordinates for the mouse and human data sets in panel b.
