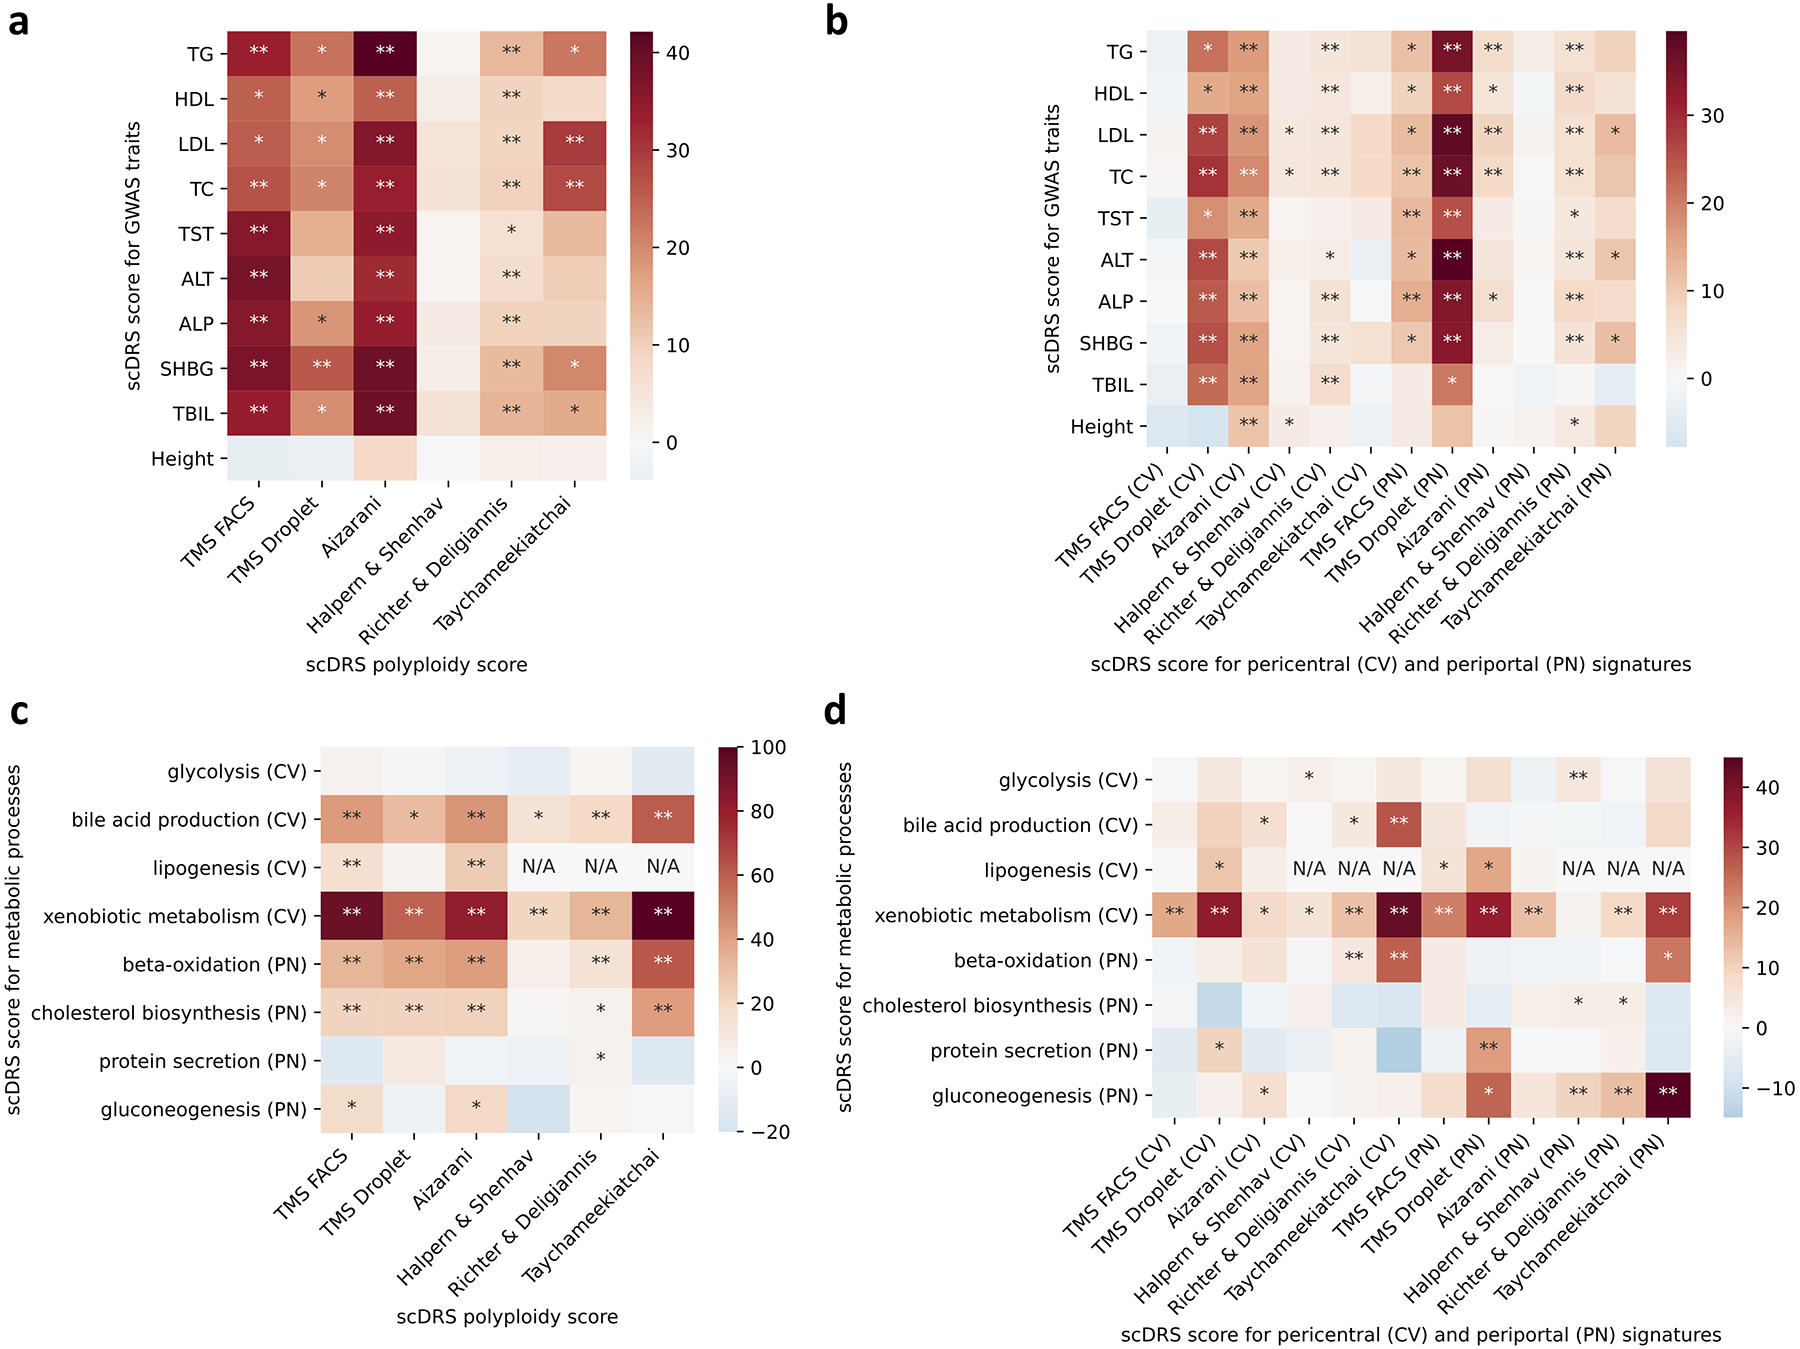
Extended Data Fig. 9. Complete results of joint regression analysis for GWAS metabolic traits and putative zonated metablic processes across the 6 data sets (extending results in Figure 5d).

(a-b) Results for the 9 metabolic traits and height, a negative control trait. The polyploidy score (panel a) and both the pericentral and periportal score (panel b) were consistently associated with the 9 metabolic traits across the data sets. The strong association (P<0.005) between the pericentral score and height in the Aizarani et al. data may be because that we inferred the pericentral score using mouse gene signatures, which are less conserved in human (as also mentioned in the original paper61). (c-d) Results for the 8 metabolic pathways. Overall, as shown in panel d, the pericentral score was associated with pericentral-specific pathways (first 4 rows) while the periportal score was associated with periportal-specific pathways (last 4 rows). * denotes P<0.05 and ** denotes P<0.005 based on one-sided MC tests.
