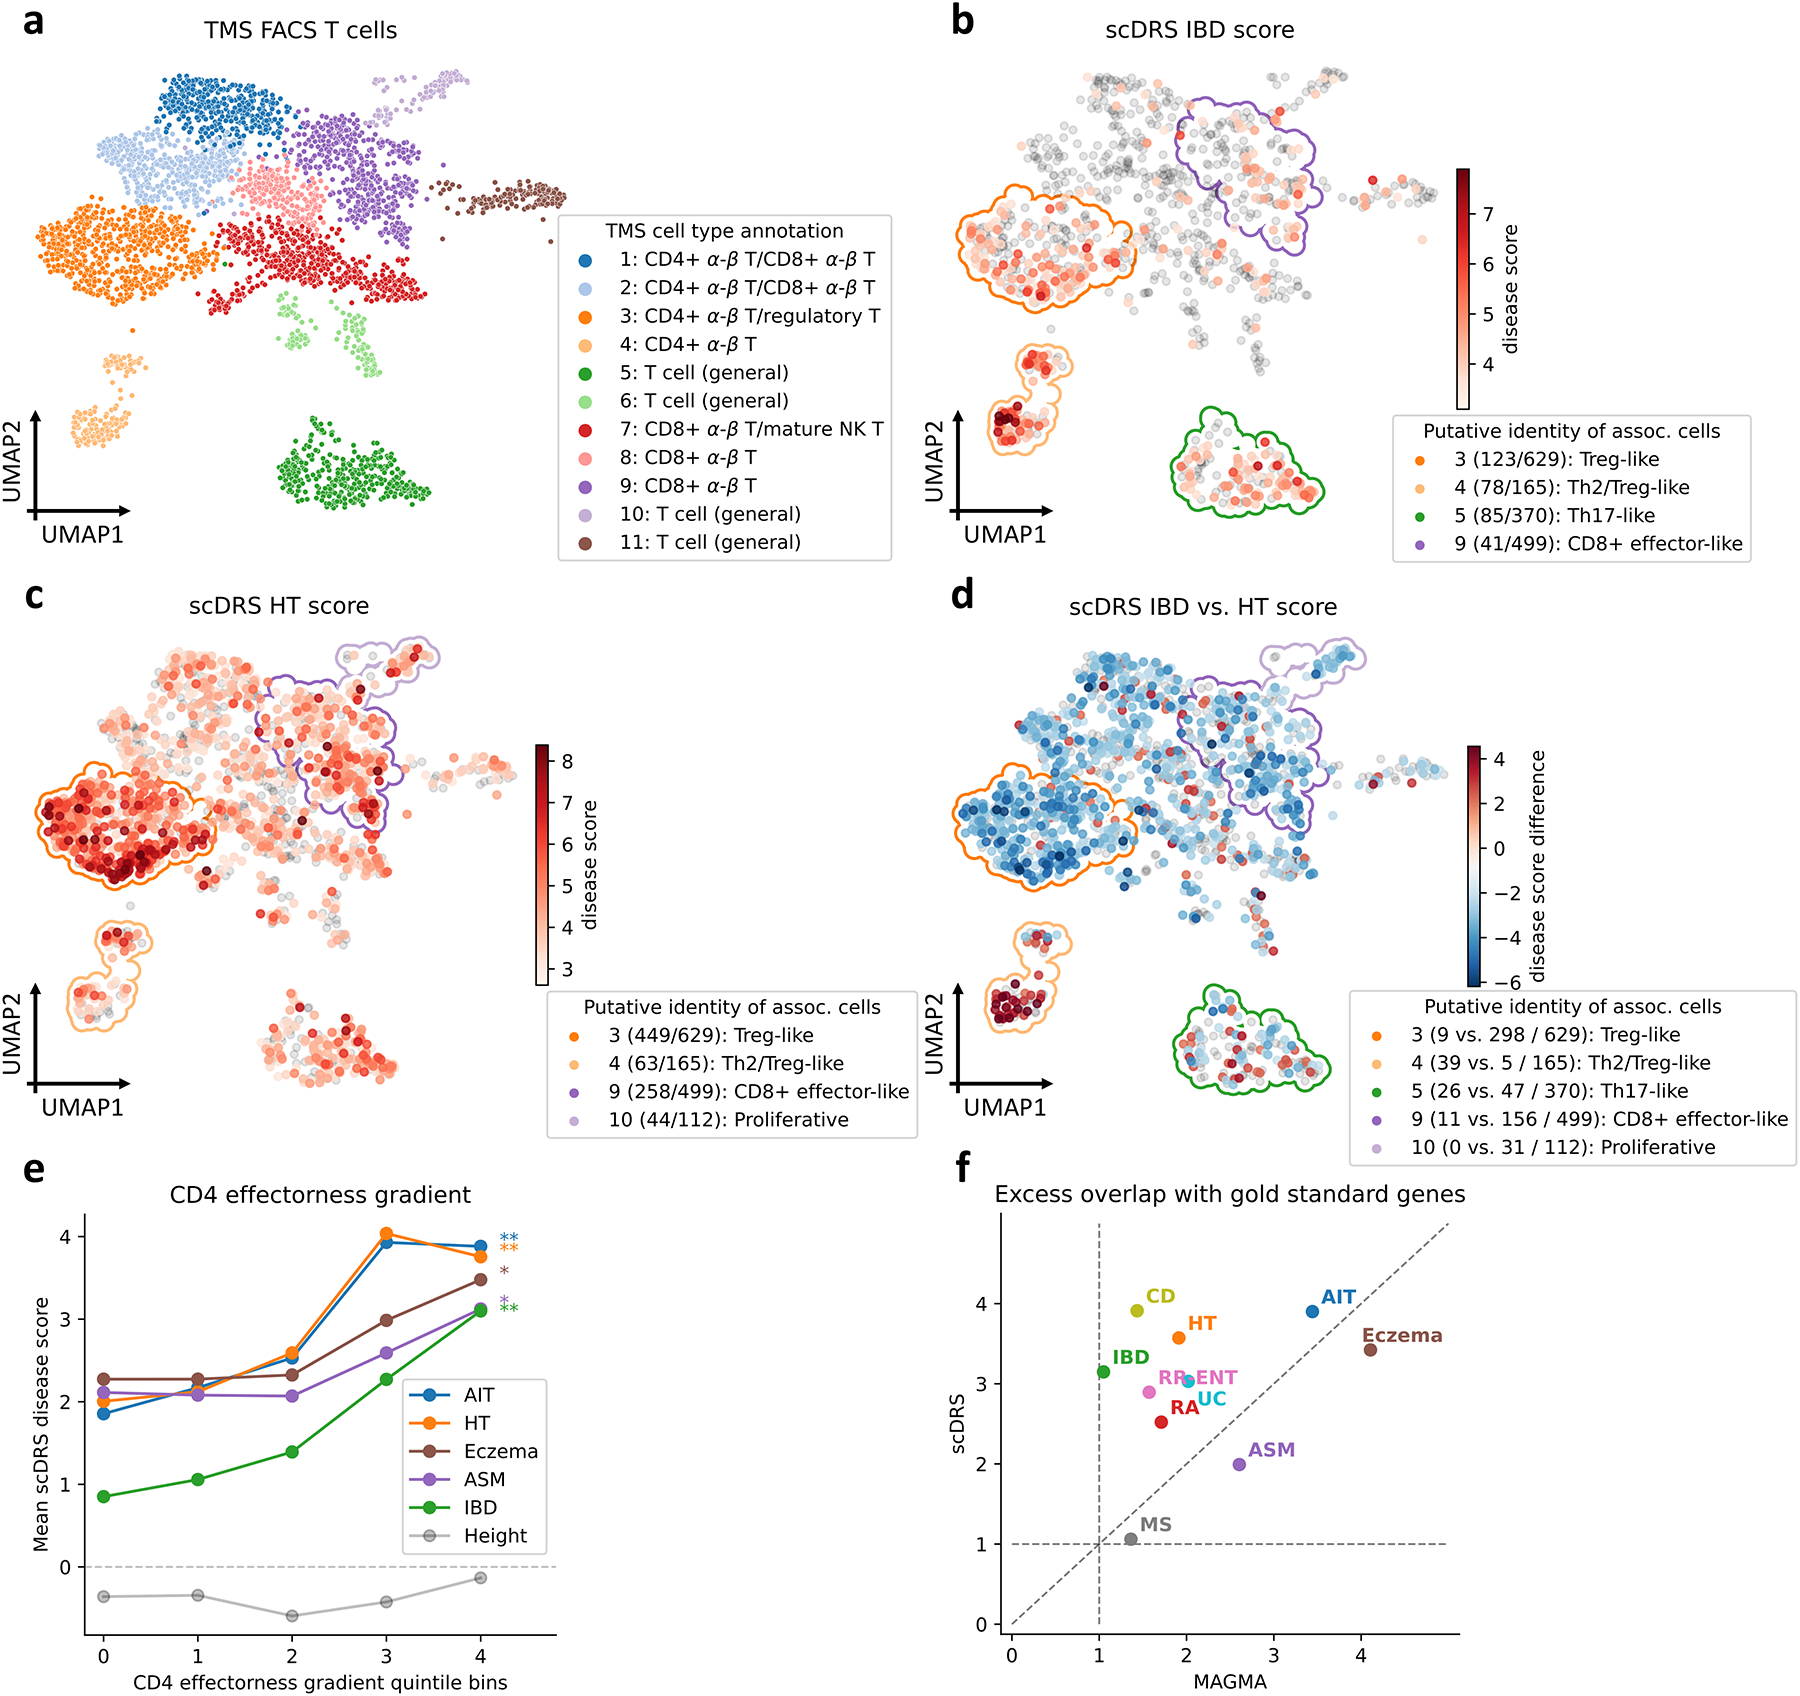
Figure 4. Associations of T cells with autoimmune diseases.

(a) UMAP visualization of T cells in TMS FACS. Cluster labels are based on annotated TMS cell types in the cluster. (b-c) Subpopulations of T cells associated with IBD and HT, respectively. Significantly associated cells (FDR<0.1) are denoted in red, with shades of red denoting scDRS disease scores; other cells are denoted in grey. Cluster boundaries indicate the corresponding T cell clusters from panel a. Clusters are annotated based on the putative identities of associated cells in the cluster, for the top 4 clusters (out of 11) with the strongest level of association (highest average disease score for associated cells in the cluster); number of disease-associated cells and number of all cells in the cluster are provided in parentheses. (d) Differences in individual cell-level associations between IBD and HT. Differentially associated cells (absolute scDRS disease score difference>2) are denoted in red and blue, with shades of colors denoting scDRS disease score differences; other cells are denoted in grey. Cluster boundaries indicate the corresponding T cell clusters from panel a. Clusters are annotated the same as in panels b,c; number of IBD-enriched cells, HT-enriched cells, and all cells in the cluster are provided in parentheses. For panels b-d, results for the other 8 autoimmune diseases are reported in Supplementary Figures 13,18. (e) Association between scDRS disease score and CD4 effectorness gradient across CD4+ T cells for 5 representative autoimmune diseases and height, a negative control trait. X-axis denotes CD4 effectorness gradient quintile bins and y-axis denotes the average scDRS disease score in each bin for each disease. * denotes P<0.05 and ** denotes P<0.005 (one-sided MC test). Numerical results for all 10 autoimmune diseases are reported in Supplementary Table 20. (f) Excess overlap with gold standard gene sets. X-axis denotes excess overlap of genes prioritized by MAGMA and y-axis denotes excess overlap of genes prioritized by scDRS, for each of the 10 autoimmune diseases. Median ratio of (excess overlap − 1) for scDRS vs. MAGMA was 2.07. Numerical results are reported in Supplementary Table 22.
