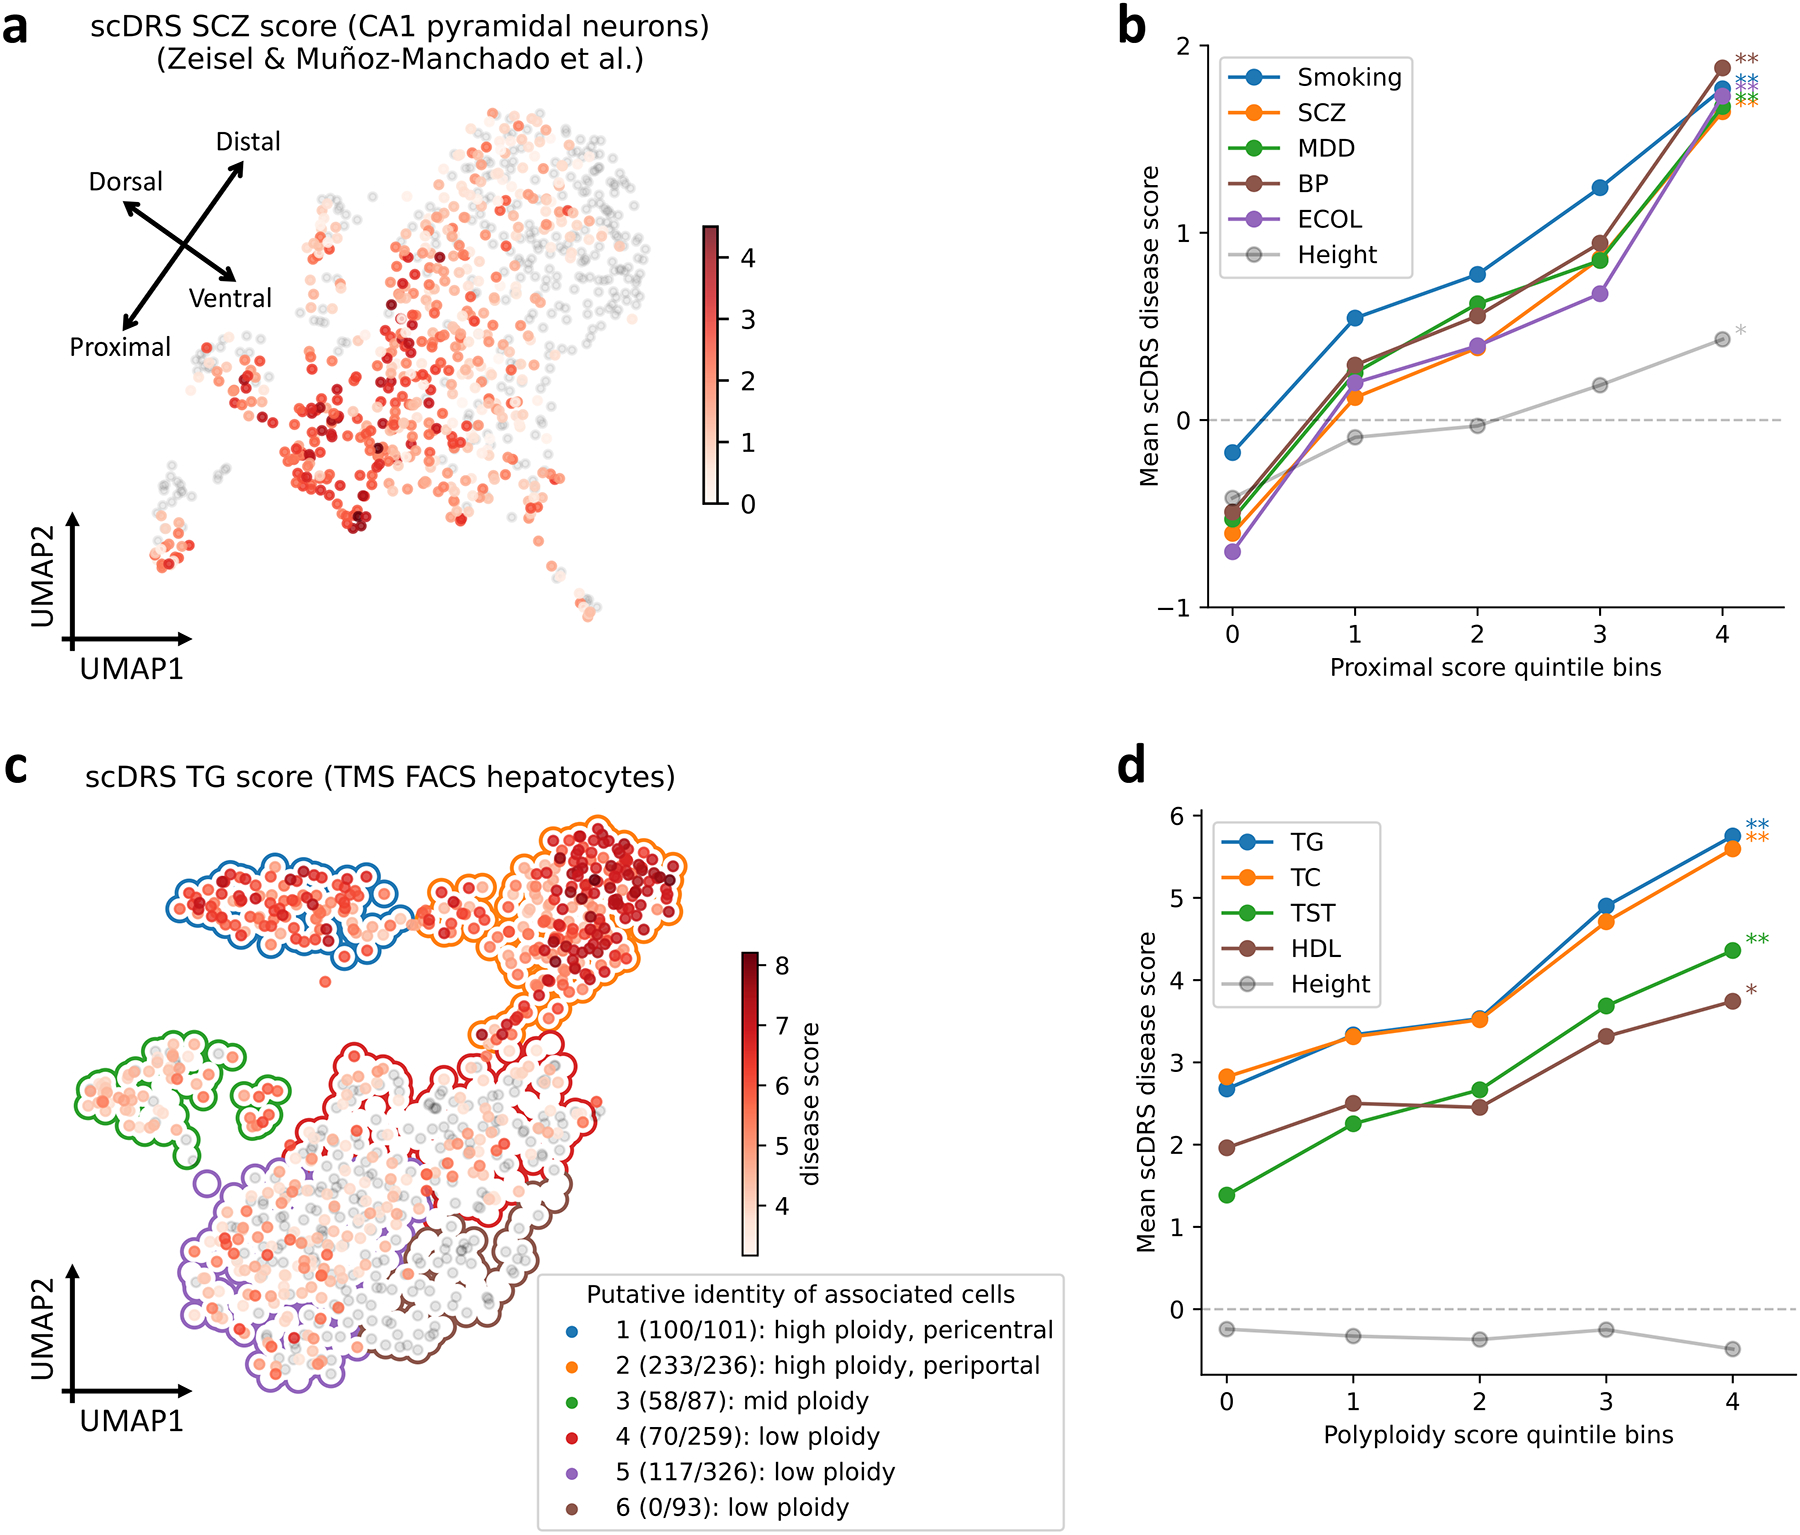
Figure 5. Associations of neurons with brain-related disease/traits and hepatocytes with metabolic traits.

(a) Subpopulations of CA1 pyramidal neurons associated with SCZ in the Zeisel & Muñoz-Manchado et al. data. Colors of cells denote scDRS disease scores (negative disease scores are denoted in grey). We include a visualization of putative dorsal-ventral and proximal-distal axes (see text). Results for all 7 brain-related diseases/traits and height are reported in Supplementary Figure 23b. (b) Association between scDRS disease score and proximal score across CA1 pyramidal neurons for 5 representative brain-related disease/traits and height, a negative control trait. The x-axis denotes proximal score quintile bins and the y-axis denotes average scDRS disease score in each bin for each disease. * denotes P<0.05 and ** denotes P<0.005 (one-sided MC test). Results for all 6 spatial scores and all 7 brain traits (and height) are reported in Extended Data Figure 8 and Supplementary Table 25. (c) Subpopulations of hepatocytes associated with TG in the TMS FACS data. Significantly associated cells (FDR<0.1) are denoted in red, with shades of red denoting scDRS disease scores; non-significant cells are denoted in grey. Cluster boundaries indicate the corresponding hepatocyte clusters. In the legend, numbers in parentheses denote the number of TG-associated cells vs. the total number of cells. Cluster labels are based on the putative identity of cells in the cluster. Results for the other 8 metabolic traits and height are reported in Supplementary Figure 25. (d) Association between scDRS disease score and polyploidy score for 4 representative metabolic traits and height, a negative control trait. The x-axis denotes polyploidy score quintile bins and the y-axis denotes average scDRS disease score in each bin for each disease. * denotes P<0.05 and ** denotes P<0.005 (one-sided MC test). Results for all 3 scores (polyploidy score, pericentral score, periportal score) and all 9 metabolic traits (and height) are reported in Extended Data Figure 9 and Supplementary Table 26.
