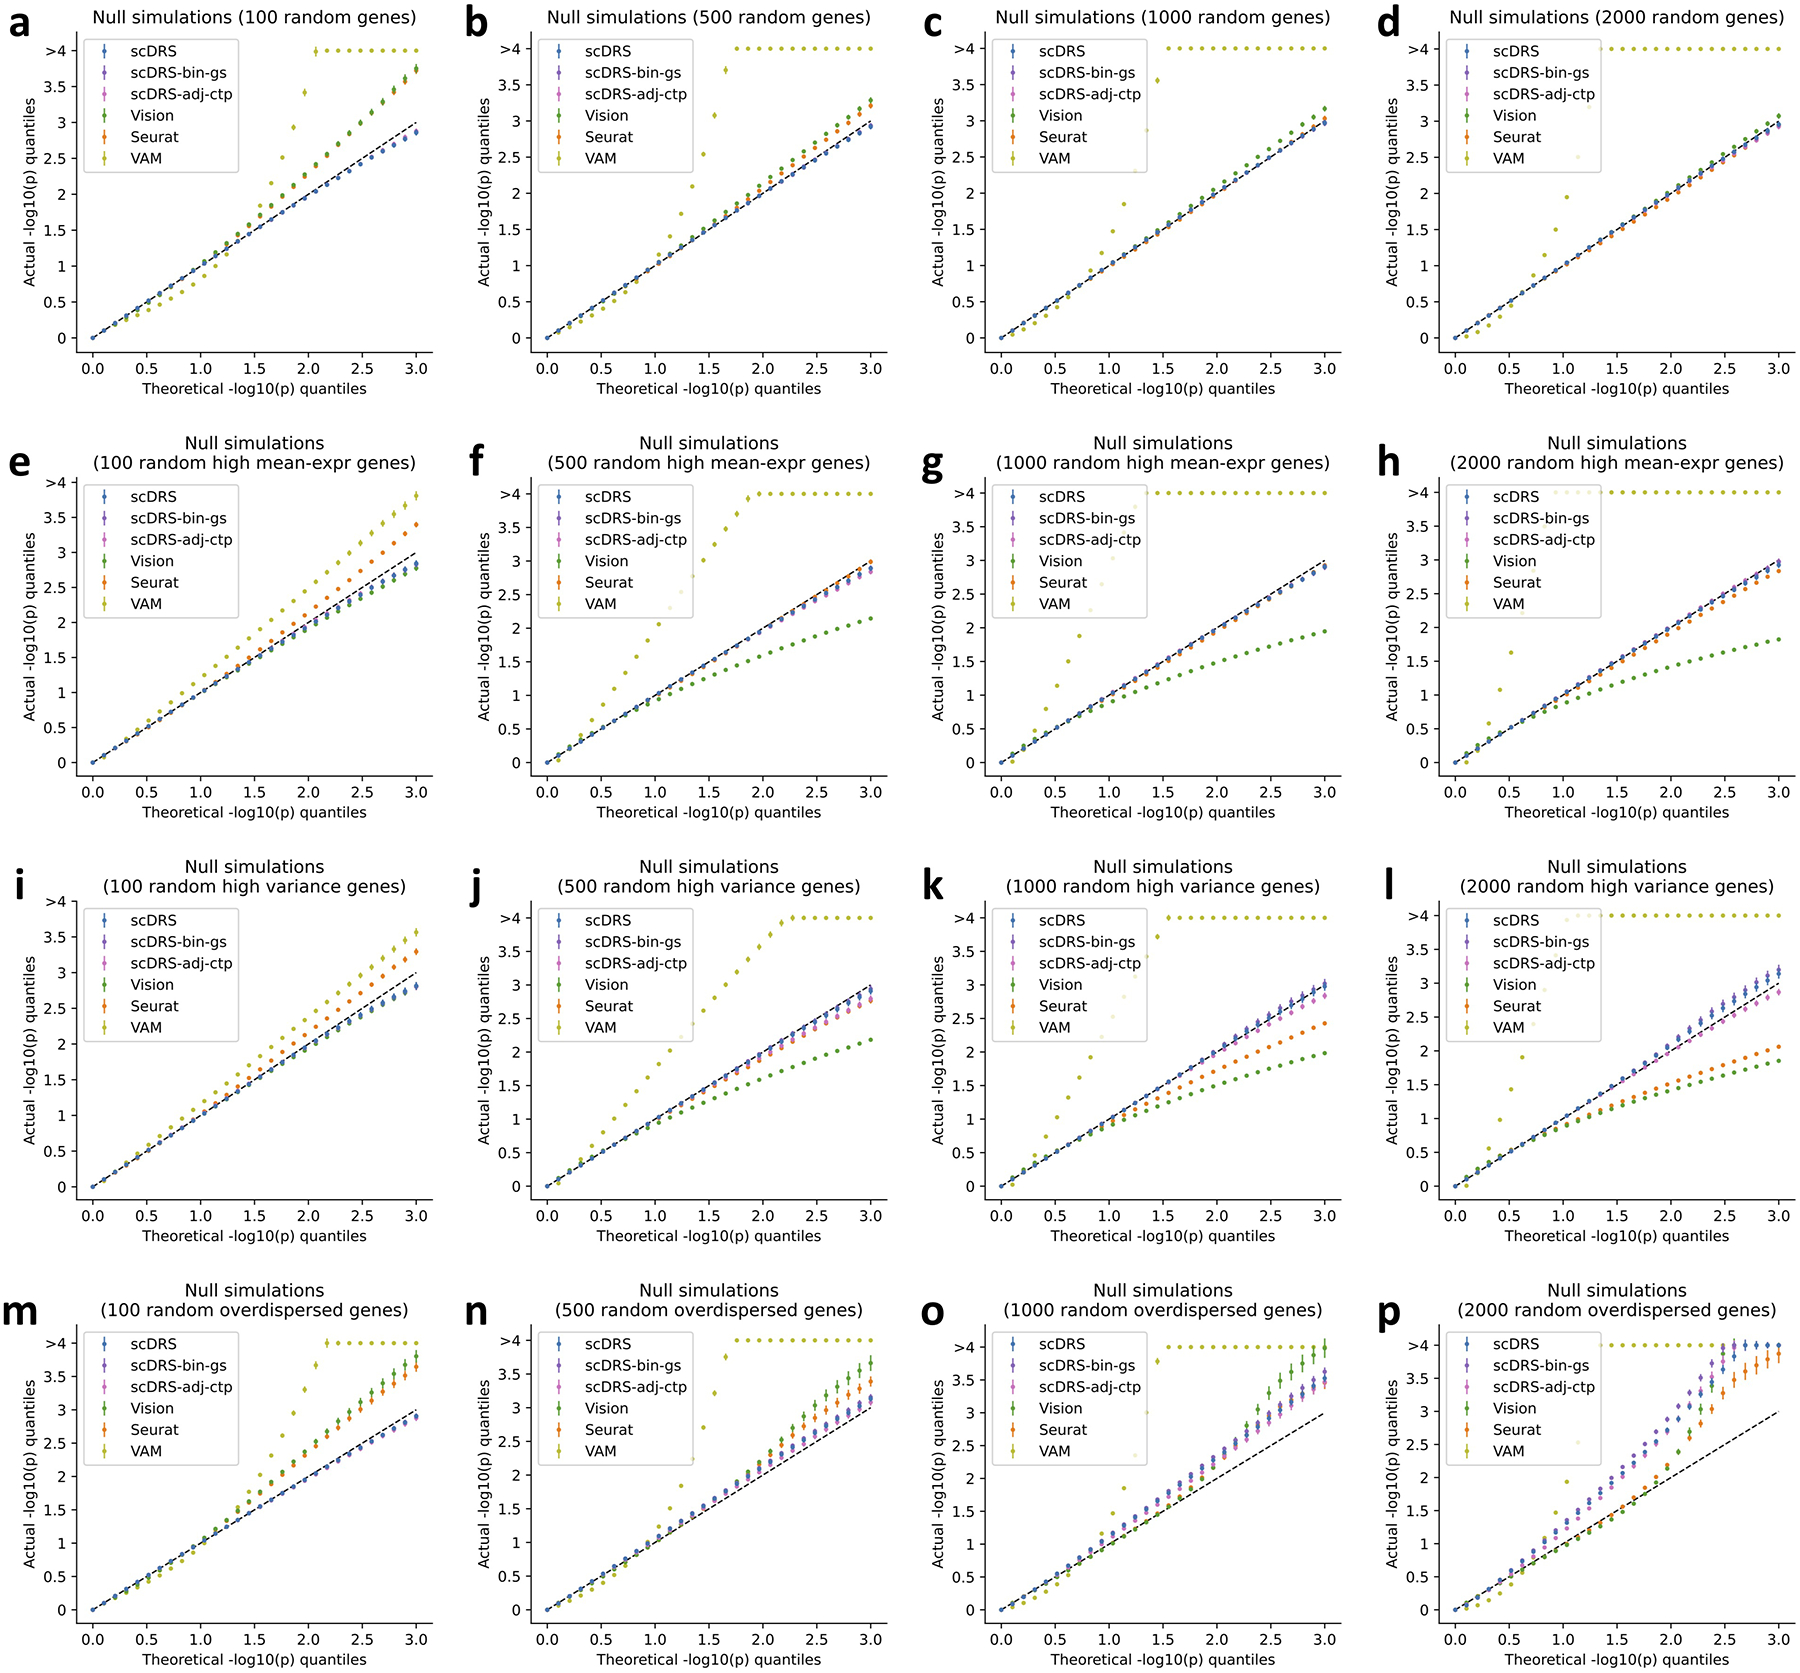
Extended Data Fig. 1. Additional null simulations.

We performed null simulations for various numbers of putative disease genes (100, 500, 1,000, and 2,000 for the four columns respectively) and various types of genes to randomly sample from: all genes (first row), and top 25% genes with high expression (second row), top 25% genes with high expression variance (third row), top 25% overdispersed genes (fourth row). We considered two additional versions of scDRS: scDRS-bin-gs (binary gene sets instead of MAGMA z-score gene weights) and scDRS-adj-ctp (adjusting for cell type proportion). For scDRS-adj-ctp, we simulated random biased gene sets (high-mean/high-variance/overdispersed) based on the balanced data (inversely weighting cells by cell type proportion) to better match the model assumption, namely testing for excess expression relative to cells in the balanced data. In each panel, the x-axis denotes theoretical −log10 p-value quantiles and the y-axis denotes actual −log10 p-value quantiles for different methods. The 3 versions of scDRS produced well-calibrated p-values in most settings and suffered slightly inflated type I error in panels o,p, possibly because it is hard to match a large number of overdispersed putative disease genes using the remaining set of genes. In comparison, all other methods are less well-calibrated and are particularly problematic when the numbers of putative disease genes are small. Error bars denote 95% confidence intervals around the mean of 100 simulation replicates.
