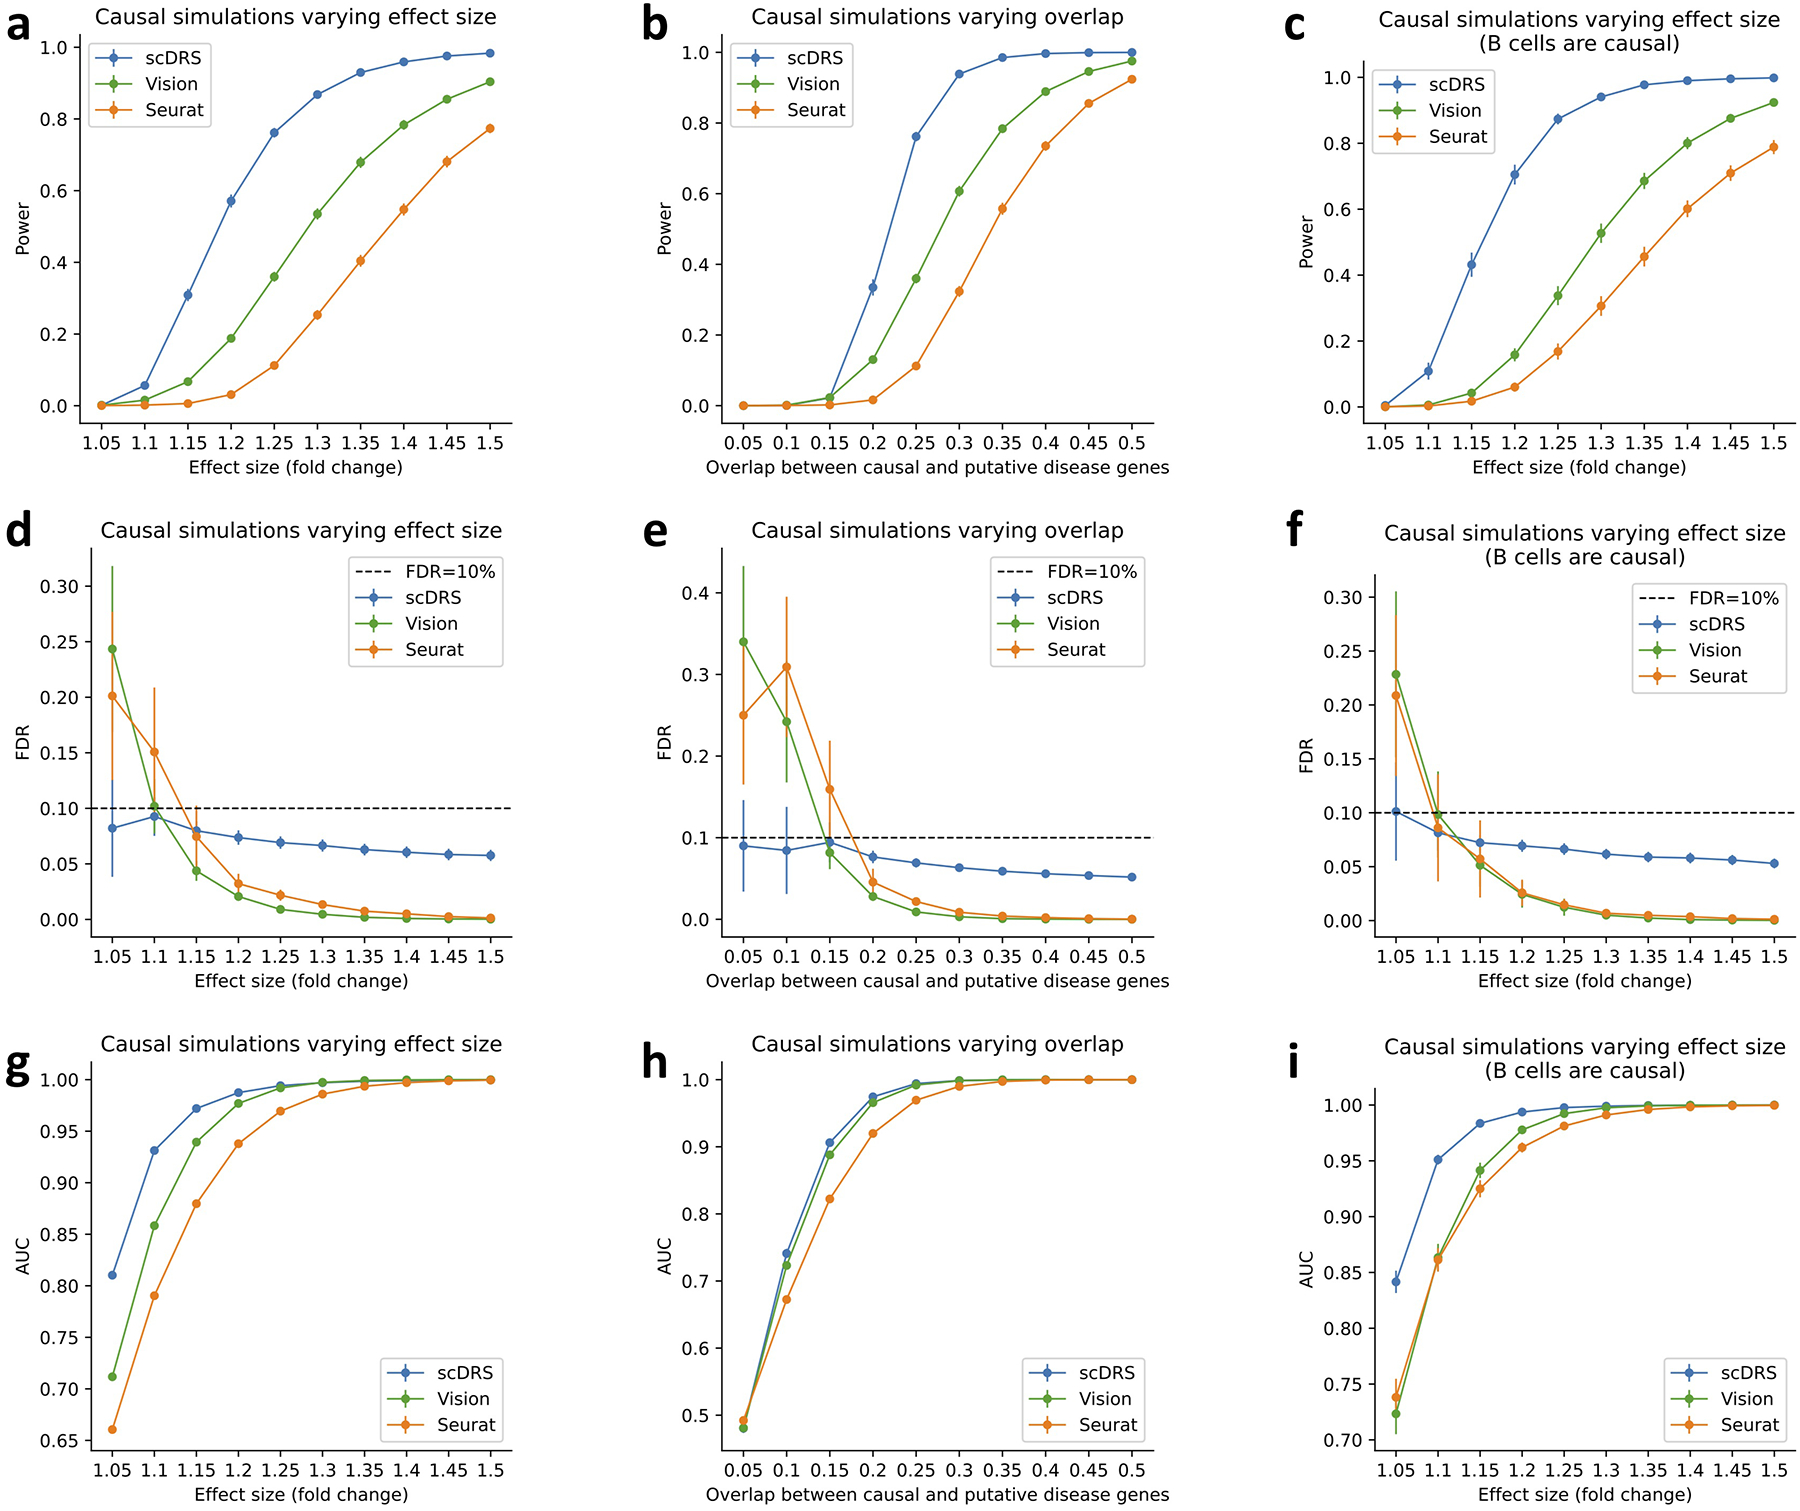
Extended Data Fig. 2. Additional causal simulations.

We performed three sets of causal simulations: (1) varying effect size from 5% to 50% while fixing 25% overlap (first column), (2) varying level of overlap from 5% to 50% while fixing 25% effect size (second column), (3) assigning the 528 B cells in the subsampled data to be causal (instead of the 500 randomly selected cells; varying effect size while fixing 25% overlap; third column). We report the power (first row), FDR (second row), and AUC for classifying causal from non-causal cells based on the p-values (third row). scDRS outperformed other methods under all metrics. Error bars denote 95% confidence intervals around the mean of 100 simulation replicates.
