

Abstract
Inductively coupled plasma mass spectrometry (ICP-MS) has proven to be an excellent analytical technique with high sensitivity for detecting low levels of long-lived radionuclides, such as thorium. However, the high-sensitivity technique increases the memory effect of thorium. This study developed a rapid, high-throughput, simple method for measuring thorium in urine using quadrupole inductively coupled plasma mass spectrometry (Q-ICP-MS). Replacing the commonly used hazardous hydrofluoric acid with a rinse solution of 0.025 mol/L oxalic acid and 5% (v/v) nitric acid eliminated the memory effect of thorium. 233U was used as internal standard in this study. The limit of detection (LOD) for thorium in this study is 0.77 ng/L, which is comparable to those of reported methods using more sophisticated and expensive sector field inductively coupled plasma mass spectrometry (SF-ICP-MS). This proposed method can determine thorium concentrations in urine in both occupationally exposed workers and populations that live in areas with high background levels of thorium.
Keywords: Thorium, Limit of Detection (LOD), Quadrupole inductively coupled plasma mass spectrometry (Q-ICP-MS), Sector field inductively coupled plasma mass spectrometry (SF-ICP-MS), Urine
Introduction
Thorium is a radionuclide that occurs naturally at low concentrations in the earth’s crust. It is less mobile and adheres very tightly in clay soil due to its low solubility in water. Anthropogenic sources are the major concern for the exposure of the public to higher than background levels of thorium. They include nuclear fuel production facilities, nuclear waste storage area, and other industry applications in processes, such as heat-resistant materials and welding rods. Thorium is toxic due to its chemical and radiological characteristics. The major pathways of thorium contamination are inhalation of thorium-contaminated dust and ingestion of food and water containing thorium. Like other radionuclides, the primary health effect of thorium is the risk of lifetime cancer mortality, particularly bone cancer. Thorium is poorly absorbed by the digestive tract, and most ingested thorium is eliminated in the urine. Therefore, there is a substantial need for an analytical method to identify and quantify thorium in urine, both to evaluate internal exposure during a radiological emergency and to monitor occupational workers and populations that live in areas with high background levels of thorium.
Thorium excreted in urine is normally at extremely low levels because of its biokinetic behavior and low solubility. Analytical methods for thorium measurement need to have low detection limits and high sensitivity and accuracy. Several analytical techniques have been reported for thorium analysis, including alpha spectrometry [1] and neutron activation analysis [2]. These methods are hindered by tedious, time-consuming sample preparation processes and/or limited availability of analytical equipment. Because of its excellent detection limits, short analysis time, and multi-isotope capability, ICP-MS has been commonly used for nuclide analysis, especially for finding long-lived radionuclides such as thorium at trace level. The two types of ICP-MS used for thorium analysis are high-resolution double-focusing sector field ICP-MS (SF-ICP-MS) [3–9] and quadrupole ICP-MS (Q-ICP-MS) [10–13]. The former has higher sensitivity and lower detection limits and is more expensive than the latter. However, both types of ICP-MS are hampered by thorium’s memory effect in their sample introduction systems: as sensitivity increases, the memory effect of thorium increases. The memory effect of thorium is more visable for SF-ICP-MS than for Q-ICP-MS because of its lower detection limit. It has been reported that the introducing of ammonia gas or ammonia can eliminate thorium memory effect [14], but it is not applicable for thorium with low concentration and sample in acid matrix in this study. Furthermore, adding hydrofluoric acid at 5% (v/v) concentration to the rinse solution can effectively wash out residual thorium in the instrument [9]. However, hydrofluoric acid is a corrosive, highly hazardous chemical. Its liquid and vapor can cause severe burns. The relatively high concentration of hydrofluoric acid (5% [v/v]) in the rinse solution of each sample analysis will make the process of waste disposal costly and complicated. This study investigated the memory effect of thorium to remove its contamination in ICP-MS using a new rinse solution without hydrofluoric acid.
In its public health role, CDC is tasked with monitoring and assessing human exposure to radionuclides through clinical screening for internal radionuclide contamination. The method developed in this study meets CDC’s requirements for a rapid, high-throughput, simple method that is easily transferable to other laboratories. It uses a Q-ICP-MS, which is less expensive and should be available in most analytical laboratories, unlike a SF-ICP-MS. This method is also designed to rapidly determine the normal background level of 232Th in the non-occupationally unexposed population, as its low limit of detection (LOD) is comparable with SF-ICP-MS.
Experimental
Reagents and solutions
All nitric acid solutions were prepared by double-distilled concentrated acid purchased from GFS Chemicals Inc. (Columbus, OH). Deionized water was used in all solutions (≥ 18 MΩ•cm, from Aqua Solutions Ultrapure Water System, Aqua Solution Inc., Jasper, GA). Oxalic acid dehydrate (99.5+%, ACS reagent, ACROS Organics, Waltham, MA) prepared as 0.025 mol/L in 5% (v/v) nitric acid was used as the rinse solution. The internal standard of 233U Certified Reference Material (CRM) 111-A was obtained from New Brunswick Laboratory, Argonne, IL. The diluent is an aqueous solution of 100 ng/L 233U in 2% (v/v) nitric acid, which was prepared by serial dilution of CRM 111-A. Base urine was collected anonymously by donations (CDC protocol 3994) and then acidified to 1% (v/v) nitric acid. Thorium calibration standards, low- and high-quality control (QC) samples, and urine pools used for LOD determination were prepared by spiking base urine with dilutions of several purchased Th standards sourced from High Purity Standards (Charleston, SC), SPEX (Edison, NJ) and Inorganic Ventures (Christiansburg, VA). Serial dilutions of Au, Hg, Os and Pt single-element standards purchased from SPEX (Edison, NJ) were spiked into base urine to check for potential polyatomic interferences. Urine samples were spiked at different concentration levels with a NIST traceable Th standard from Inorganic Ventures (Christiansburg, VA) for accuracy and precision tests. Biological Reference Material (BRM) of Quebec Multielement External Quality Assessment Scheme (QMEQAS) obtained from Centre de toxicology, Institut national de santé publique du Québec (INSPQ) (Québec, Canada) was also used to evaluate the precision of the method.
Sample and calibration standard preparation
Frozen urine samples were thawed to room temperature and shaken to mix well before pipetting. QC samples and patient urine samples were prepared for analysis by adding 0.5 mL of each to 4.5 mL of diluent in individual 15 mL centrifuge tubes. The tubes were then shaken or vortexed to mix well. External, matrix-matched calibrators were prepared by adding 0.05 mL of each intermediate standard (50, 200, 800, 3,000, 10,000 ng/L in 2% [v/v] nitric acid) into the corresponding labeled 15 mL centrifuge tube containing 0.45 mL of pooled urine and 4.5 mL of diluent and mixed well. The concentrations of Th in the final working calibration standards were 5, 20, 80, 300, and 1,000 ng/L. The prepared samples and calibration standards have similar concentrations of internal standard 233U at 90 ng/L.
Instrumentation
Thorium was measured by a quadrupole ICP-MS NexION® 300D (PerkinElmer, Waltham, MA, USA), which had a unique triple cone interface, a Universal Cell ion-filtering design and 90° ion path, and platinum sampler and skimmer cones. The autosampler hyphenated with Q-ICP-MS for sample introduction is SC-4 DX (Elemental Scientific Inc., Omaha, NE) with dual flowing rinse and four large racks. NexION software version 1.5 was used for data acquisition, storage, and reprocessing. In the method file, Th calibration was set up as weighted linear regression, and the blank subtraction was processed after the internal standard correction. Th data acquisition timing was optimized based on the minimal relative standard deviation of obtained results of 232Th and 233U. They were determined as 100 sweeps per reading, one reading for each replicate. A total of three replicates were collected. Counts of 238U were also checked to monitor the potential 238U exposure/contamination in urine in this method. Table 1 shows the detailed instrumental operation parameters.
Table 1.
NexION 300D ICP-MS parameters for 232Th analysis
| Operation Mode | Standard |
|---|---|
| Nebulizer Gas Flow [NEB] | 0.85–1.0 |
| Auxiliary Gas Flow | 1.05–1.2 |
| Plasma Gas Flow | 18 |
| ICP RF Power | 1600 |
| Analog Stage Voltage | −2300 |
| Pulse Stage Voltage | 1200 |
| Discriminator Threshold | 13 |
| Deflector Voltage | −6.75 |
| Quadrupole Rod Offset [QRO] | 0 |
| Cell Entrance/Exit Voltage | 0 |
| Regression Type | Simple linear |
| Analyte for Analysis | 232Th |
| Analyte for Monitoring U interference | 238U |
| Internal Standard | 233U |
| Sweep/Reading | 100 |
| Readings/Replicate | 1 |
| Replicates | 3 |
| Blank Subtraction | After internal standard |
| Total Acquistion Time | 4 min. 29 sec. |
Results and discussion
Th memory effect and carryover
The memory effect of Th has long been observed when Th was measured by ICP-MS [15, 16]. The memory effect likely resulted from the absorption of Th in the sample introduction system of ICP-MS. This adverse characteristic would cause significant sample carryover, therefore resulting in inaccurate Th results. Extending the washout time of the rinse solution can help with removing Th absorbed in the instrument; however, the more effective way is to consider the requirement of high-sample throughput in the method to determine the appropriate rinse solution. Nitric acid at different concentrations and a mixture of nitric acid and oxalic acid were considered for their ability to remove Th in the sample introduction system of the instrument. The concentrations of blanks were measured after the urine samples using the rinse solution mentioned above for comparison. Fig. 1 shows that the carryover of Th in blanks were elevated with the increase of Th concentrations in urine samples. In samples with similar Th concentrations, the carryover of Th reduced when the rinse solution of nitric acid had higher concentrations (5%) compared with lower concentration (2%). Moreover, the rinse solution of the mixture of 5% nitric acid and 0.025 mol/L oxalic acid eliminated the memory effect of Th for samples with Th up to 5,000 ng/L. Using this mixture made the measured concentrations of Th in blanks negligible (see Fig. 1). In this study, the mixture of nitric acid and oxalic acid was selected as the rinse solution throughout the sample analysis. The potential carryover of Th between samples using this selected rinse solution was further investigated by sequentially measuring 10 urine samples that were spiked at concentrations of 1,000 ng/L with Th, which was equal to the concentration of highest calibration standards, and the 19 blanks (see Fig. 2). The concentrations of 19 blanks versus the measured sequence were shown in Fig. 3. No elevated tendency of Th concentrations of either samples or blanks was observed in Fig. 2 and Fig. 3, and the blanks were ranged within 0.5 ng/L shown in Fig. 3. The use of oxalic acid, which is non-hazardous at low concentration in the rinse solution, successfully substituted the hazardous hydrofluoric acid used in previous Th methods at the CDC laboratory [9, 10].
Fig. 1.
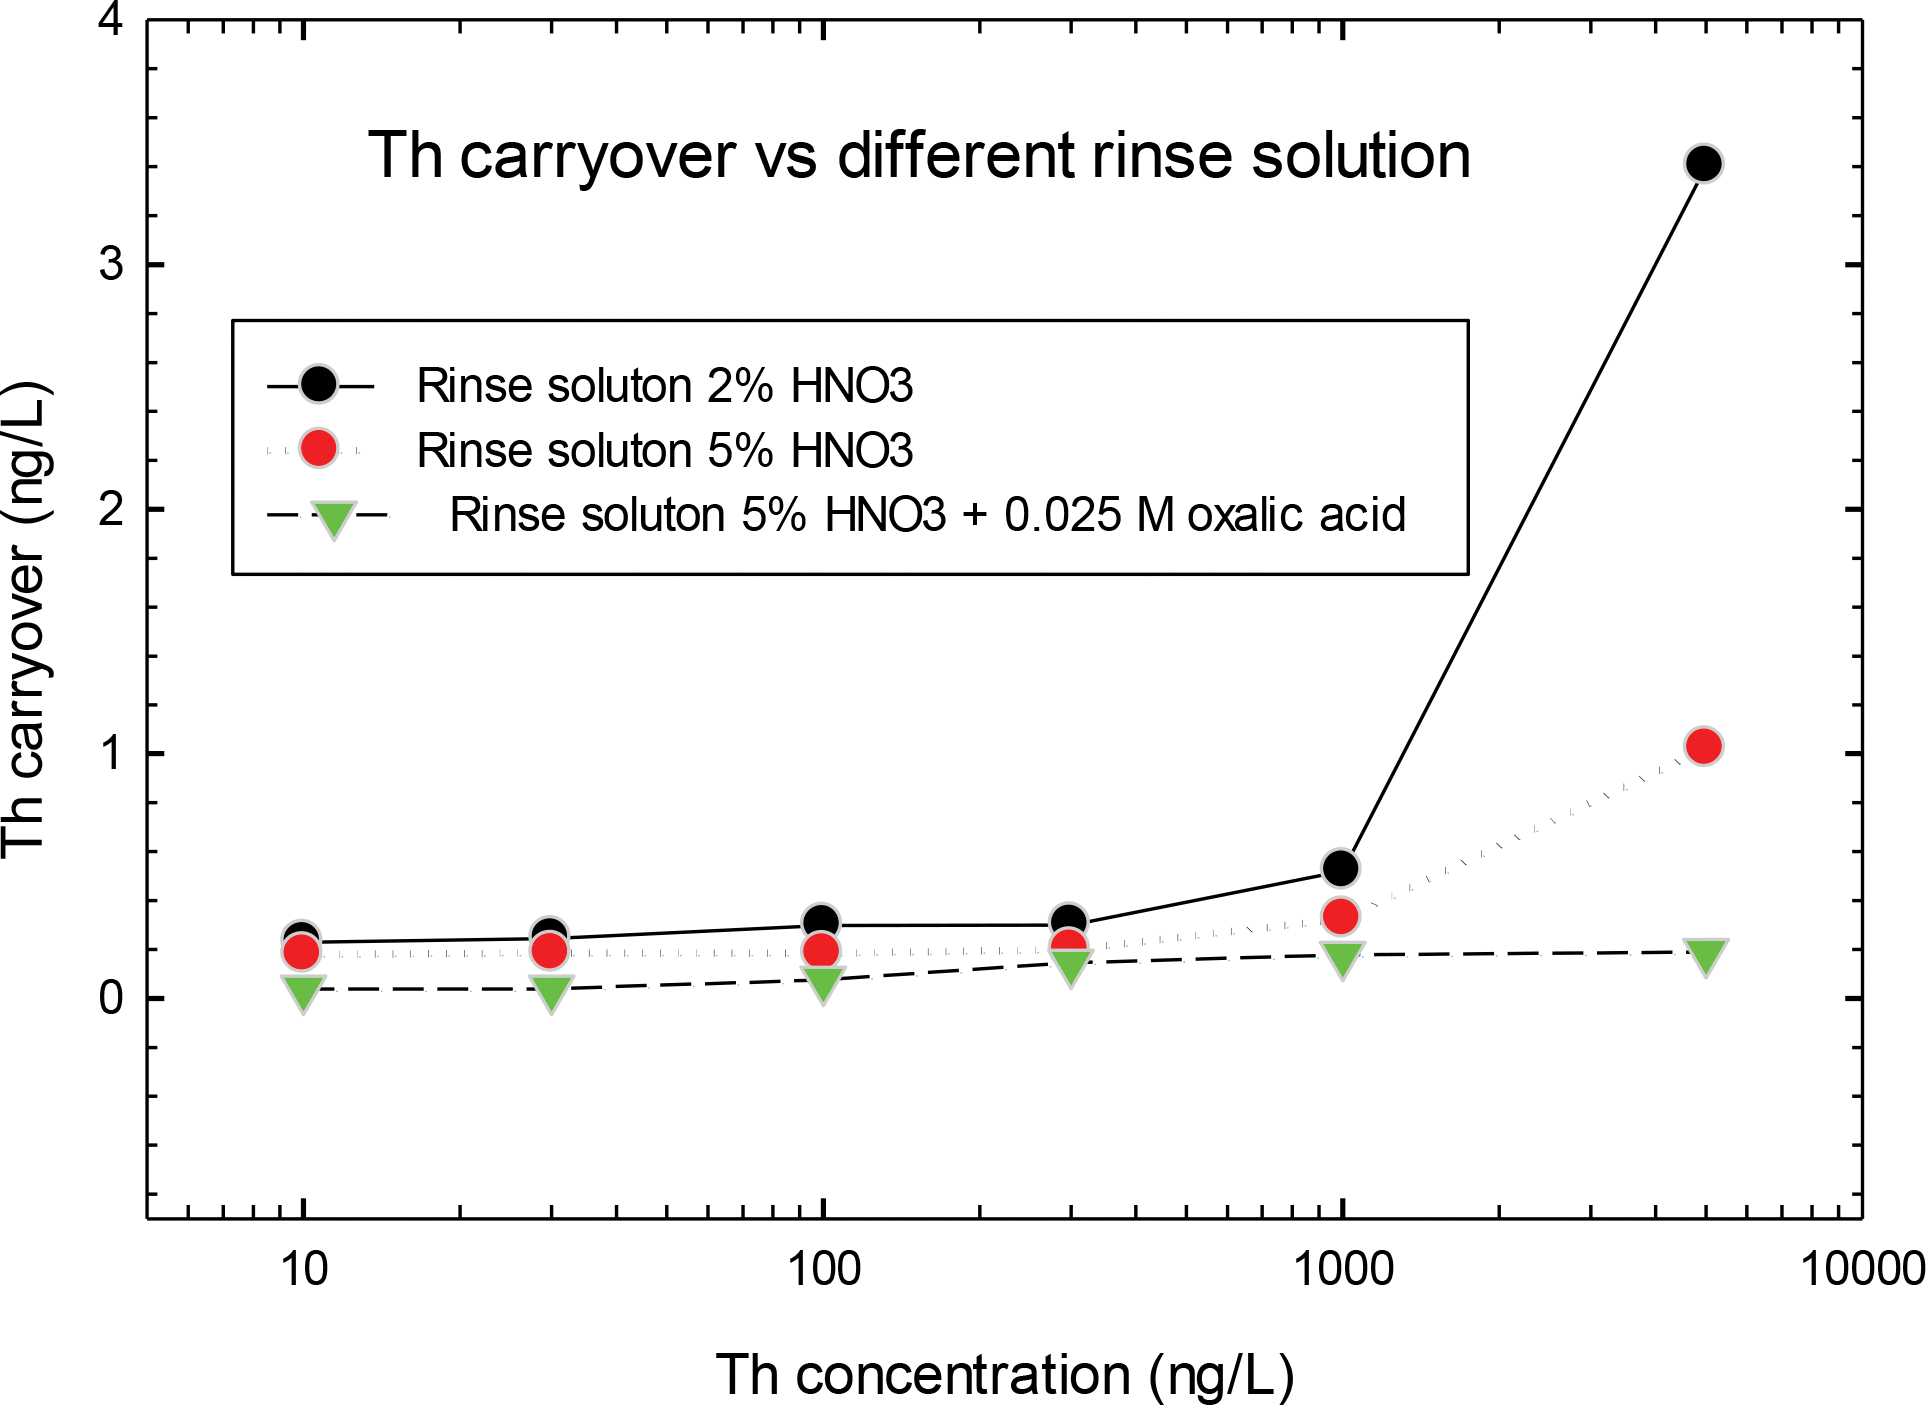
Comparison of Th carryover with different rinse solution
Fig. 2.

Th carryover versus sample measured sequence
Fig. 3.

The concentration of Th blank versus the measured sequence
Spectral interference
The major potential spectral interference for Th measurements in urine is the polyatomic interferences, which include the compounds of impurities of Au, Hg, Os and Pt combined with Ar, Cl, P and S. They would overlap analyte of 232Th at mass number 232 as 197Au35Cl, 198Hg34S, 199Hg33S, 200Hg32S, 201Hg31P, 192Os40Ar, 192Pt40Ar, 194Pt38Ar, 195Pt37Cl, 196Pt36Ar, 198Pt34S. Contributions to analyte signals from these impurities in a urine matrix were tested by spiking them into base urine. The spiked Hg in base urine were at concentrations approaching the National Health and Nutrition Examination Survey (NHANES) 95th percentile of 5 μg/L [17]. Because no NHANES survey data was available for Au, Os and Pt, they were spiked at potential maximum concentration levels of 5 μg/L, 1 μg/L, and 1 μg/L, respectively. No observed signal at mass 232 was identified during analysis of base urine spiked with these impurities. The measured concentrations of 232Th at mass 232 were comparable with the Th blank in base urine, and they were below the LOD of this method. Therefore, there was no significant effect on measured 232Th results resulting from the spiked impurities. The other spectral interferences are the hydride 232Th1H+ and the tailing effect of 232Th to internal standard 233U. The contributions from 232Th1H+ and 232Th to mass 233 were evaluated by measuring 232Th at a concentration of 1,000 ng/L (concentration of the highest calibration standard) without adding the internal standard 233U. The test results showed the gross contribution from 232Th1H+ and 232Th were negligible, which was only 0.03% compared with the intensity of spiked internal standard 233U at 90 ng/L.
Linearity
A linearity test was performed to investigate the ability of the analytical method to yield results that were proportional to analyte concentration in a linear fashion. The calibration model used was weighted linear regression of five concentrations of calibration standards. This method demonstrated excellent linear signal response in a range of 0 to 1,000 ng/L for 232Th with a typical correlation coefficient of ≥ 0.9999. The urine sample was diluted with 2% (v/v) nitric acid to bring the concentration of Th within the calibration range, in case the concentration of Th exceeds the highest calibration standard of 1,000 ng/L.
Precision and accuracy
This analytical method used QC samples at both low and high Th concentrations at the beginning and the end of each analytical run. Therefore, judgments regarding between-run precision and analytical accuracy could be made over the calibrated Th concentration range on the day of analysis. The analytical run precision is judged based on both QC results within the run and between runs. The data generated with these assessments are then used to estimate methodological imprecision and to assess the magnitude of any time-associated trends. The accuracy test in this study was based on the obtained recoveries of 232Th spiked urine samples. Six urine samples from two separated urine pools were spiked with a known amount of 232Th at three concentration levels (see Table 2). The recoveries of six spiked urine samples shown in Table 2 were in a range of 93.5–98.0%, which fulfilled the FDA accuracy requirement of 85–115%. Table 3 shows the precision of measuring the two QC and two spiked urine materials for several independent analytical runs. The run precision for all the QC and spiked urine materials was within 6% in relative standard deviation (RSD). We performed 60 analytical runs over 15 months for low and high QC, in contrast to 16 runs and 2 months for the two spiked urine materials. The concentrations of measured 232Th demonstrated a bias of within 3% compared with the target values as shown in Table 3. BRM made by Centre de toxicology/INSPQ was also used to evaluate the method precision in this study. Six BRMs of QMEQAS urine samples were measured on eight different days, and their Th results are listed in Table 4. As shown in Table 4, the precision of Th judged by the RSD is within 3.4%, which is in accordance with the typical analytical precision of ICP-MS techniques. The measured concentrations of Th are in good agreement with the BRM target values. Except for sample QM-U-Q1510 with bias of −16.9%, all the others are within ± 4%. The larger bias for QM-U-Q1510 is more likely because of the heterogeneity of the BRM sample other than the potential contamination during process of sample preparation and analysis. QM-U-Q1510 had the lowest Th concentration among the BRM samples, and its measured value was still within two standard deviations of the target value.
Table 2.
Accuracy using spike recovery for 232Th (ng/L)
| Sample 1 Measured concentration | Sample 2 Measured concentration | ||||||||||
|---|---|---|---|---|---|---|---|---|---|---|---|
| Replicate | Spike Concentration | Day 1 | Day 2 | Mean | Recovery (%) | Spike Concentration | Day 1 | Day 2 | Mean | Recovery (%) | |
|
| |||||||||||
| Sample | 1 | <LOD | <LOD | <LOD | <LOD | ||||||
| 2 | 0 | <LOD | <LOD | 0 | <LOD | <LOD | |||||
| 3 | <LOD | <LOD | <LOD | <LOD | |||||||
| Sample + Spike 1 | 1 | 13.5 | 14.2 | 14.0 | 93.5 | 43.6 | 43.1 | 43.3 | 96.2 | ||
| 2 | 15 | 13.9 | 14.6 | 45 | 43.2 | 42.4 | |||||
| 3 | 13.8 | 14.2 | 43.3 | 44.3 | |||||||
| Sample + Spike 2 | 1 | 145 | 144 | 145 | 96.5 | 298 | 290 | 294 | 98.0 | ||
| 2 | 150 | 148 | 143 | 300 | 297 | 293 | |||||
| 3 | 146 | 144 | 295 | 292 | |||||||
| Sample + Spike 3 | 1 | 589 | 583 | 585 | 97.5 | 784 | 784 | 782 | 97.7 | ||
| 2 | 600 | 584 | 584 | 800 | 785 | 776 | |||||
| 3 | 588 | 581 | 781 | 780 | |||||||
Table 3.
The precision of measured concentrations of 232Th for QC and spiked urine materials (ng/L)
| Sample | N (number of runs) | Average concentration (ng/L) | SD | RSD (%) | Target value c (ng/L) | Bias (%) |
|---|---|---|---|---|---|---|
|
| ||||||
| Low QCa | 60 | 47.2 | 2.68 | 5.7 | 50 | −5.6 |
| High QCa | 60 | 741 | 31.0 | 4.2 | 750 | −1.2 |
| Pool-1b | 16 | 39.1 | 1.6 | 4.1 | 40 | −2.3 |
| Pool-2 b | 16 | 194 | 4.1 | 2.1 | 200 | −3.0 |
Internal quality control material made at CDC by spiking certified reference material in pooled urine collected anonymously
Urine materials made at CDC by spiking certified reference material into pooled urine collected anonymously
Target values of spiked QCs and urine pools using NIST traceable certified reference material from High Purity Standards (Charleston, SC) and Inorganic Ventures (Christiansburg, VA)
Table 4.
Measurement of Biological Reference Material (BRM) of 232Th provided by the Centre de toxicology / INSPQ
| Runa | QM-U-Q1413 ng/L) | QM-U-Q1414 ng/L) | QM-U-Q1503 ng/L) | QM-U-Q1504 ng/L) | QM-U-Q1509 ng/L) | QM-U-Q1510 ng/L) |
|---|---|---|---|---|---|---|
|
| ||||||
| 1 | 214.8 | 91.2 | 88.3 | 317.6 | 403.1 | 29.6 |
| 2 | 218.3 | 93.5 | 91.4 | 320.9 | 416.0 | 31.5 |
| 3 | 221.9 | 94.9 | 93.0 | 334.2 | 424.4 | 31.8 |
| 4 | 216.5 | 93.1 | 90.5 | 325.9 | 414.6 | 31.2 |
| 5 | 208.2 | 87.8 | 85.9 | 309.9 | 394.6 | 29.3 |
| 6 | 206.4 | 88.2 | 86.8 | 308.2 | 391.9 | 29.3 |
| 7 | 209.8 | 90.3 | 88.5 | 316.5 | 397.9 | 30.1 |
| 8 | 208.0 | 88.2 | 86.1 | 307.3 | 394.0 | 29.5 |
| Average | 213.0 | 90.9 | 88.8 | 317.6 | 404.6 | 30.3 |
| SD | 5.6 | 2.7 | 2.6 | 9.3 | 12.2 | 1.0 |
| RSD (%) | 2.7 | 3.0 | 2.9 | 2.9 | 3.0 | 3.4 |
| BRM target valuesb | 218.6 | 94.7 | 91.7 | 310.9 | 417.7 | 36.4 |
| 2 SDb | 20.3 | 9.1 | 8.3 | 17.8 | 68.2 | 6.7 |
| Bias (measured value to BRM target value, %) | −2.6 | −4.0 | −3.1 | 2.1 | −3.1 | −16.9 |
| Recovery (%) | 97.4 | 96.0 | 96.9 | 102.1 | 96.9 | 83.1 |
BRM samples were measured in 8 runs of different days
the unit of BRM target values was converted from nmol/L to ng/L
Limit of detection
The LOD for Q-ICP-MS in this study was determined using Taylor’s method [18], which measures the standard deviation of repeated measurements of low concentration samples that approach a zero concentration. The blank of base urine and four low-concentration LOD samples of 0.5, 1.0, 1.5 and 3.5 ng/L were measured in 20 runs for the LOD determination. The standard deviation versus the concentration for LOD samples is shown in Fig. 4. The slope and intercept of the linear regression line were obtained and used for the following calculation according to the formula: ConcLOD = [mean b + 1.645(Sb + int)]/[1–1.645(slope)], where mean b = blank average, Sb = standard deviation of blank average, int = intercept of the equation in Fig.4, Slope = slope of the equation in Fig.4. The LOD of this method was 0.77 ng/L. This is an improvement compared with our previous Th analytical methods which had LODs of 2.9 ng/L and 0.85 ng/L using SF-ICP-MS [8, 9].
Fig. 4.

The standard deviation of four low-concentration samples versus their measured concentrations
Conclusions
In this study, we presented a method for rapid determination of Th at low concentrations in urine samples using Q-ICP-MS. This method provides the high sensitivity of Th analysis, and it can detect Th at sub- ng/L level, with an LOD that is comparable with that of a more expensive SF-ICP-MS. No significant polyatomic spectral interference was derived from the potential urine matrix impurities. In addition, the memory effect of Th was successfully eliminated by introducing oxalic acid instead of using the much more hazardous hydrofluoric acid in the rinse solution. The precision and accuracy of the method were confirmed through the results of measured spiked urine samples and BRMs provided by the Centre de toxicology/INSPQ. These results showed good agreement with the target values. The described procedures are simple; it is essentially a ”dilute-and-shoot” analytical method with minimal sample preparation. In summary, this high-throughput method is transferrable to other laboraotories for dose assessment of contaminated individuals in the scenario of a radiological emergency, as well as for evaluation of a large group of the population that beleives they have been contaminated.
Acknowledgements
The authors would like to thank Dr. Steve Pappas at DLS/NCEH, Centers for Disease Control and Prevention for help in the analytical method development.
Footnotes
Conflict of Interest
The authors declare that they have no competing interest.
Disclaimer
The findings and conclusions in this study are those of the authors and do not necessarily represent the views of the U.S. Department of Health and Human Services or the Centers for Disease Control and Prevention. Use of trade names and commercial sources is for identification only and does not constitute endorsement by the U.S. Department of Health and Human Services or the Centers for Disease Control and Prevention.
References
- 1.Azeredo AMGF Julião LMQC, Santos MS Melo DR, Lipsztein JL (1994) Uranium and thorium exposures associated with conventional mining. J Radioanal Nucl Chem 182:127–132 [Google Scholar]
- 2.Pleskach SD (1985) Determination of U and Th in urine by neutron activation. Health Phys 48:303–307 [DOI] [PubMed] [Google Scholar]
- 3.Al-Jundi J, Werner E, Roth P, Höllridgl V, Wendler I, and Schramel P (2001) Thorium and Uranium Contents in Human Urine: Influence of Age and Residential Area. J. Environ. Radioactivity 71:61–70 [DOI] [PubMed] [Google Scholar]
- 4.Benkhedda K, Epov VN, Evans RD (2005) Flow-Injection Technique for Determination of uranium and thorium isotopes in urine by inductively coupled plasma mass spectrometry. Anal Bioanal Chem 381:1596–1603 [DOI] [PubMed] [Google Scholar]
- 5.Oeh U, Andrasi A, Bouvier-Capely C, Carlan LD, Fischer H, Franck D, Höllriegl V, Li WB, Ritt J, Roth P, Schmitzer C, Wahl W, Zombori P (2007) Implementation of Bioassay Methods to Improve Assessment of Incorporated Radionuclides. Radiation Protection Dosimetry 125: 444–448 [DOI] [PubMed] [Google Scholar]
- 6.Shi Y, Collins R, Brome C (2013) Determination of Uranium, Thorium and Plutonium Isotopes by ICP-MS. J. Radioanal Nucl. Chem 296:509–515 [Google Scholar]
- 7.Höllriegl V, Greiter M, Giussani A, Gerstmann U, Michalke B, Roth P, Oeh U (2007) Observation of changes in urinary excretion of thorium in humans following ingestion of a therapeutic soil. J. Environ. Radioactivity 95:149–160 [DOI] [PubMed] [Google Scholar]
- 8.Pappas RS, Ting BG, Jarrett JM, Paschal DC, Caudill SP, Miller DT (2002) Determination of uranium-235, uranium-238 and thorium-232 in urine by magnetic sector inductively coupled plasma mass spectrometry. J. Anal. At. Spectrom 17:131–134 [Google Scholar]
- 9.Ting BG, Paschal DC, Jarrett JM, Pirkle JL, Jackson RJ, Sampson EJ, Miller DT, Caudill SP (1999) Uranium and thorium in urine of United States residents: reference range concentrations. Envir. Res. Section A 81:45–51 [DOI] [PubMed] [Google Scholar]
- 10.Roth P, Werner E, Wendler I, Schramel P (1996) Application of ICP-MS for the assessment of thorium excretion in urine. Appl. Radiat. Isot 47: 1055–1056 [DOI] [PubMed] [Google Scholar]
- 11.Baglan N, Cossonnet C, Ritt J (2001) Determination of 232Th in urine by ICP-MS for individual monitoring purposes. Health Phys 81: 76–81 [DOI] [PubMed] [Google Scholar]
- 12.Ting BG, Paschal DC, Caldwell KL (1996) Determination of thorium and uranium in urine with inductively coupled argon plasma mass spectrometry. J. Anal. At. Spectrom 11:339–342 [Google Scholar]
- 13.Schramel P, Wendler I, Roth P, Werner E (1997) Method for the determination of thorium and uranium in urine by ICP-MS. Mikrochim Acta 126:263–266 [Google Scholar]
- 14.Al-Ammar A, Reitznerová E, Barnes R (2001) Thorium and iodine memory effects in inductively-coupled plasma mass spectrometry. Fresenius J Anal Chem 370: 479–482 [DOI] [PubMed] [Google Scholar]
- 15.Igarashi Y, Kim CK, Takaku Y, Shiraishi K, Yamamoto M, Ikeda N (1990) Application of inductively coupled plasma mass spectrometry to the measurement of long-lived radionuclides in environmental samples: A review. Anal Sci 6:157–164 [Google Scholar]
- 16.Bailey EH, Camp AJ, Ragnarsdottir V (1993) Determination of uranium and thorium in basalts and uranium in aqueous solution by inductively coupled plasma mass spectrometry. J Anal At Spectrom 18:551–556 [Google Scholar]
- 17.Fourth National Report on Human Exposure to Environmental Chemicals, 2009. (Updated Tables, February 2015). Centers for Disease Control and Prevention, Atlanta. http://www.cdc.gov/exposurereport/. Accessed 20 April 2022 [Google Scholar]
- 18.Taylor JK (1987) Quality Assurance of Chemical Measurements. Lewis Publishers, Chelsea, Michigan. 79–82 [Google Scholar]