Fig. 1.
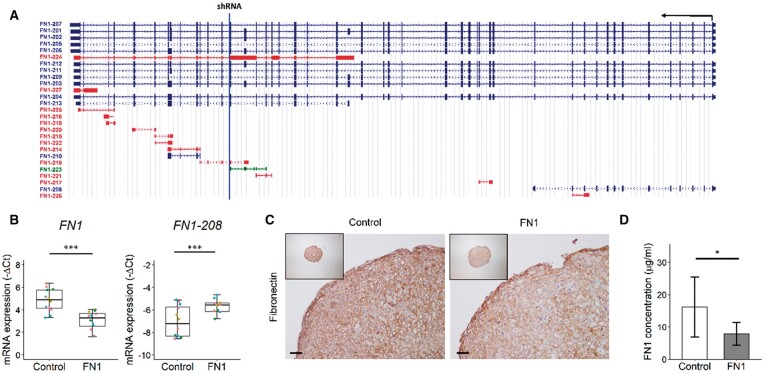
Downregulation of FN1 gene and protein expression in neo-cartilage pellets after 3 days of chondrogenesis
(A) Schematic representation of FN1 transcripts, which are transcribed from the antisense strand, represented by the black arrow. The blue line represents the location of the target sequence of the shRNA targeting FN1 transcripts. Blue transcripts are protein coding, red and green transcripts are non-protein coding. Source: https://genome.ucsc.edu/. (B) Gene expression levels depicted by boxplots of −ΔCt values of FN1 and FN1-208 ratio relative to all full-length FN1 transcripts in neo-cartilage pellets of primary chondrocytes transduced with non-targeting shRNA (control) and FN1 targeting shRNA (FN1). Individual samples are represented by coloured dots; colours of dots represent the different donors (n = 12). (C) Representative images of fibronectin staining of control and FN1 downregulated pellets, confirming FN1 downregulation on the protein level. Scale bar = 50 µm. (D) Fibronectin concentration in conditioned medium in the control (n = 6) and FN1 group (n = 5), as determined by ELISA. Data are mean (s.d.). P-values were determined by GEEs, with experimental readout as the dependent variable and donor and group as covariates. *P < 0.05, ***P < 0.005. Colour version is available at Rheumatology online.

