Fig. 3.
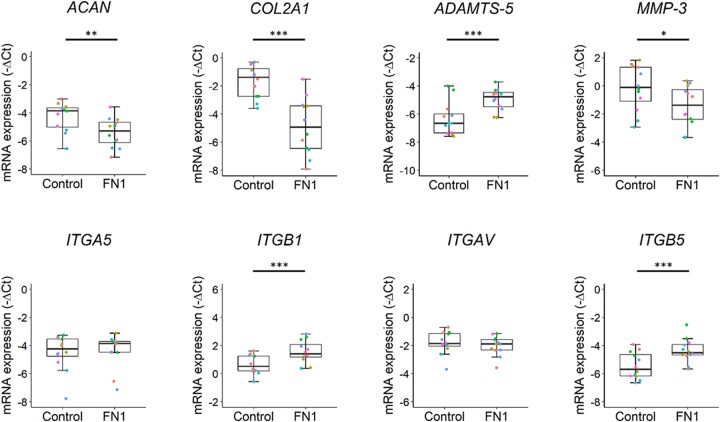
Decreased FN1 expression and change of FN1 transcript ratios results in catabolic chondrocyte metabolism.
Boxplots of −ΔCt values of cartilage matrix–relevant genes ACAN, COL2A1, ADAMTS-5, MMP-3, ITGA5, ITGB1, ITGAV and ITGB5 in neo-cartilage pellets of primary chondrocytes transduced with non-targeting shRNA (control) (n = 12) and FN1 targeting shRNA (FN1) (n = 12). Individual samples are represented by coloured dots; colours of dots represent the different donors. P-values were determined by GEEs, with experimental readout as the dependent variable and donor and group as covariates. *P < 0.05, **P < 0.01, ***P < 0.005. Colour version is available at Rheumatology online.

