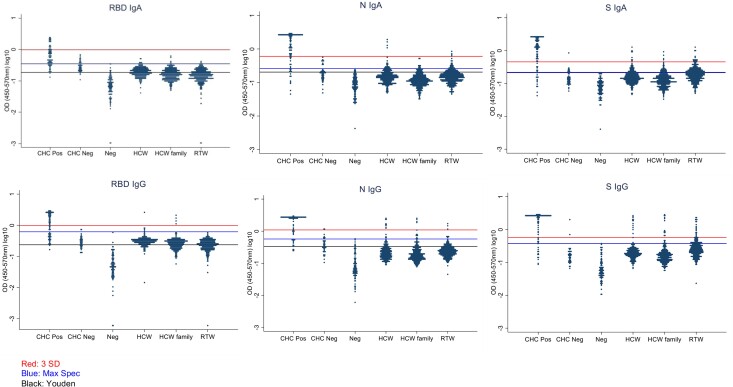
Figure 1.
Optical density (OD) value distribution among each measured subgroup. OD values (450-570nm) were plotted according to each antigen-isotype combination and subgroup (y-axis in log10 scale). The top horizontal line in the graph indicates the cut off for the 3 standard deviation above the mean threshold method (3 SD). The second line indicates the cut off when the threshold was chosen at the highest value of the negative controls (Max Spec). The third line indicates the cut off when the threshold was chosen based on the Youden threshold (Youden). Note, the last two lines converge for S IgA and S IgG. Abbreviations: CHC Neg, PCR-negative CHCs (COVID-19 Hospitalized Case); CHC Pos, PCR confirmed hospitalized COVID-19 patients; HCW, health care workers; HCW Family, family members of health care worker listed under HCW; N, SARS-CoV-2 nucleocapsid protein; Neg, negative controls; RBD, SARS-CoV-2 receptor-binding domain; RTW, return to work employees who had been working remotely from March to August of 2020, during the first COVID-19 wave in Worcester, MA; S Trimer; SARS-CoV-2 spike trimer.

