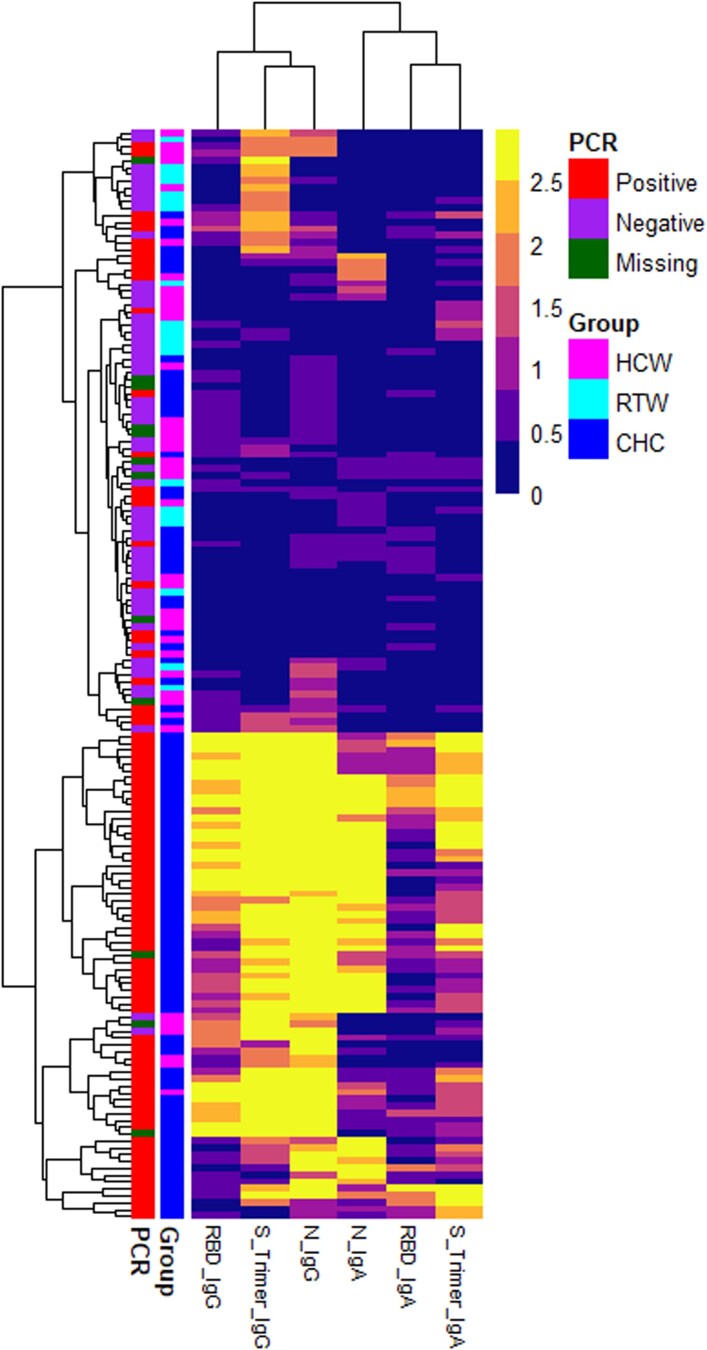
Figure 2.
Heat map of optical density (OD) values. A heat map was built based on unbiased clustering of the OD values of the experimental subgroups with at least one positive antigen-isotype combination. The OD values are represented in the color scale, ranging from blue to yellow. The results clustered by isotype, rather than antigen (see top branching into immunoglobulin [Ig]G and IgA from left to the right). Abbreviations: CHC, COVID-19 hospitalized case; HCW, healthcare workers and their family members; N, severe acute respiratory syndrome coronavirus 2 (SARS-CoV-2) nucleocapsid protein; RBD, SARS-CoV-2 receptor-binding domain; RTW, return-to-work employees who had been working remotely from March to August 2020, during the first COVID-19 wave in Worcester, Massachusetts; S trimer, SARS-CoV-2 spike trimer.

