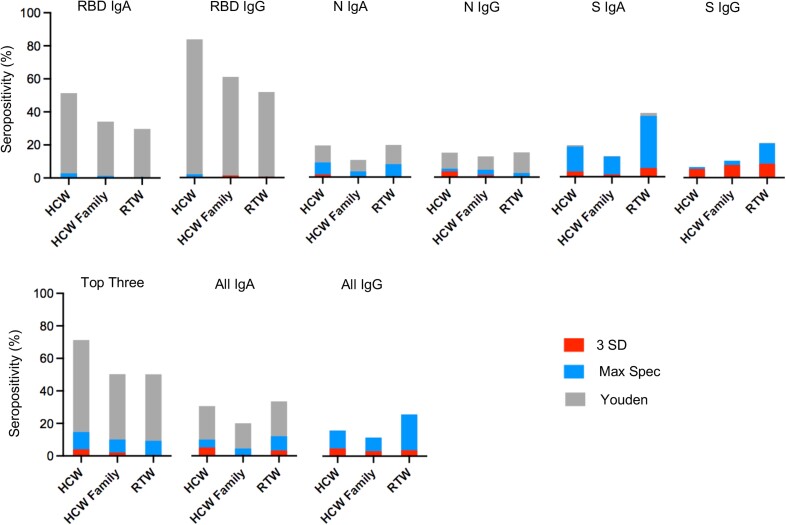
Figure 3.
Seropositivity of each subgroup, according to the antigen-isotype combination. The red bars represent the seroprevalence based on the threshold defined as the mean + 3 SDs among negative controls (3 SD). The blue bars represent the seroprevalence based on the maximum specificity threshold (Max Spec). The black bars represent the seroprevalence based on the Youden threshold (Youden). Abbreviations: HCWs, healthcare workers; HCW Family , family members of participating HCWs; Ig, immunoglobulin; N, severe acute respiratory syndrome coronavirus 2 (SARS-CoV-2) nucleocapsid protein; RBD, SARS-CoV-2 receptor-binding domain; RTW, return-to-work employees who had been working remotely from March to August of 2020, during the first coronavirus disease 2019 wave in Worcester, Massachusetts; S trimer, SARS-CoV-2 spike trimer; Top Three, combination of the three antigen/isotype combinations (RBD IgG, N IgG, and RBD IgA) with the largest area under the ROC curve (i.e., with maximum sensitivity and specificity).

