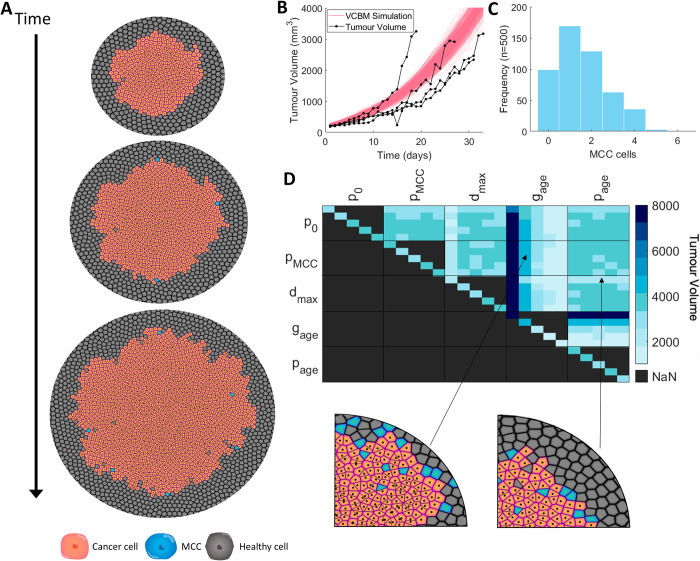
Fig 4. Using the VCBM to model control tumour growth.
(A) Snapshots of the model simulation at 0, 5 and 10 days with cancer cells in orange, MCCs in blue and healthy cells in grey (a zoomed in version is in Fig I in S1 Text). (B) Mia–PaCa–2 tumour volume over 33 days measured in vivo in mice (black, n = 4). Overlaid is the tumour volume from the VCBM simulation (pink, n = 500) with parameters from Table C in S1 Text. (C) MCC counts in the VCBM simulations (n = 500). (D) Sensitivity analysis of control tumour growth. Maximum tumour volume over 33 days for perturbations of parameters with weights of 0.25, 0.75, 1.25, 1.75 and 2.25, and spatial plots of large and small tumours simulated using the depicted weightings. In the heatmap, each pixel represents 500 averaged simulations with two parameters. In the boxes, the parameters vertically and horizontally in the grid are the weightings in ascending order, with each pixel being a “coordinate” representing the weighting for each parameter and the result from 500 averaged tests. Diagonal pixels only use individual parameters with different weightings. Legend for cell colouring: cancer cell (orange) healthy cell (grey), MCC (blue).

