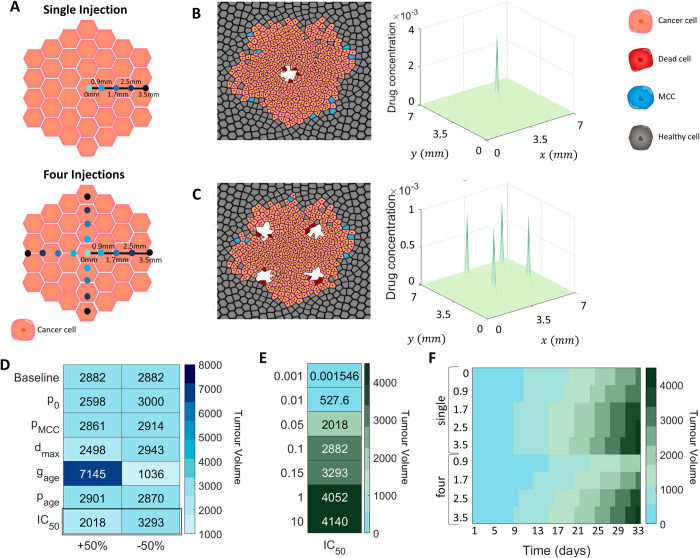
Fig 5. Impact of intratumoural free–drug point injections on tumour cell eradication.
(A) Tumour growth was investigated under different gemcitabine single free–drug injections: central, 0.9 mm from centre, 1.7 mm from centre, 2.5 mm from centre, 3.5 mm from centre. Locations of injections on the tumour surface for a single free–drug injection or four free–drug injections is depicted schematically. (B) VCBM with a single central injection and the drug concentration at 24h. (C) The tumour volume with four injections placed 30μm from the centre, and the drug concentration at each location at 6h. (D) Maximum tumour volume over 33 days for ±50% perturbations in parameter values compared to the normal value (i.e. baseline parameter values). (E) Maximum tumour volume over 33 days for different perturbations of IC50 compared to the normal volume. (F) The tumour volume over 33 days with each injection protocol, averaged over 500 simulations. Legend for cell colouring: cancer cell (orange) healthy cell (grey), MCC (blue), dead cell (read). Note, the white space in the simulation images represents ‘empty space’ in the tumour where dead cells have been previously, but have since disintegrated.

