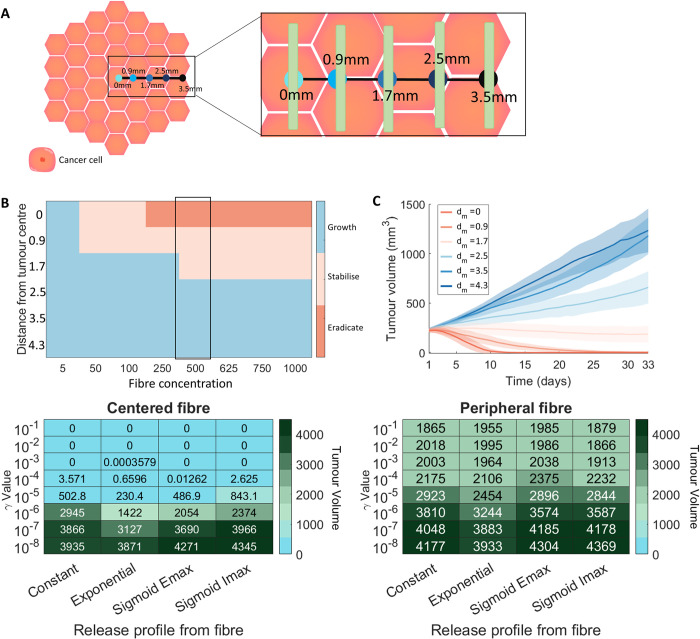
Fig 6. Comparison of different fibre release and placement options.
(A) Tumour growth was investigated under different gemcitabine–loaded fibre placements dm: central, 0.9 mm from centre, 1.7 mm from centre, 2.5 mm from centre, 3.5 mm from centre and 4.3 mm from centre. Locations of fibres on tumour surface for single implantations is depicted schematically. (B) A heatmap for the averaged final state of a tumour after 33 days of simulation for different initial injection concentrations and fibre placements. “Eradicate” denotes a tumour volume below 1mm3, “stabilise” denotes a tumour volume less than the initial tumour volume, and “growth” denotes a tumour volume greater than the initial tumour volume. (C) The mean (solid lines) and standard deviation (shades areas) of the tumour volume over 33 days for different fibre placement options with corresponding values highlighted in (B). (D) The tumour volume on day 33 for different release rates (indicated by the γ value) and release profiles with a central fibre placement. (E) The tumour volume on day 33 for different release rates (indicated by the γ value) and release profiles with a fibre placed on the edge of the tumour (3.5 mm away from centre). See Section TS3 in S1 Technical Supplementary Information for more details on these release functions. Legend for cell colouring: cancer cell (orange).

