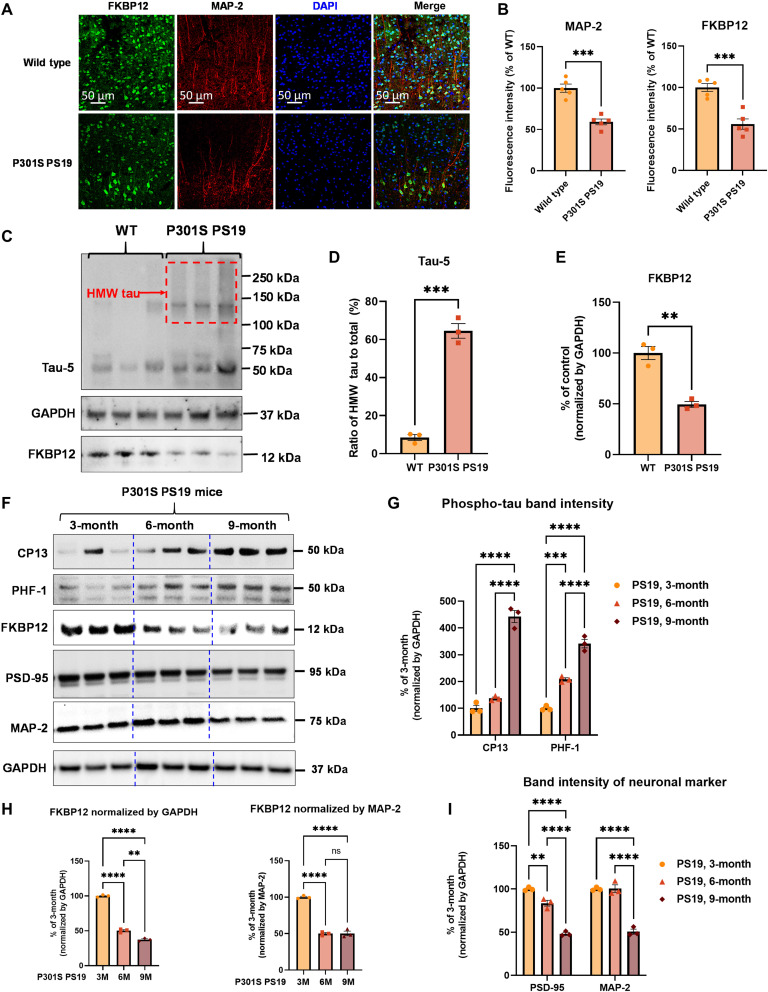
Fig. 1. FKBP12 is decreased in PS19 mice brain.
(A) Representative images showing the distribution of FKBP12 in entorhinal cortex of mouse brain. Scale bars, 50 μm. (B) Quantification of MAP-2 and FKBP12 fluorescence intensity in entorhinal cortex of PS19 mice brain in comparison to age-matched wild type (WT). Data are expressed as means ± SEM. N = 5. Statistics by unpaired t test, ***P < 0.005. (C) Representative Western blot showing high–molecular weight (HMW) tau aggregation in PS19 mice brain lysate and the decrease of FKBP12 in comparison to wild type. GAPDH, glyceraldehyde-3-phosphate dehydrogenase. (D) Quantification of the tau-5 band intensity showing the robust increase of the ratio between high–molecular weight tau to monomeric tau. (E) Quantification of the FKBP12 band intensity. (F) Representative Western blot images showing the expression level of phosphorylated tau (CP13 and PHF-1), FKBP12, and neuronal markers [postsynaptic density 95 (PSD-95) and MAP-2] in the brain lysate of 3-, 6-, and 9-month-old PS19 mice, respectively. (G) Quantification of the phosphorylated tau (CP13 and PHF-1) band intensity. Result was normalized by internal control of corresponding GAPDH band intensity. (H) Quantification of FKBP12 Western blot (WB) band intensity normalized by GAPDH and MAP-2, respectively. Statistics by one-way analysis of variance (ANOVA), post hoc multiple comparisons test by Tukey’s test. (I) Quantification for the band intensity of neuronal markers including PSD-95 and MAP-2, normalized by GAPDH. Data are expressed as means ± SEM. N = 3. Statistics by two-way ANOVA, and post hoc multiple comparisons test by Tukey’s. **P < 0.01, ***P < 0.005, and ****P < 0.001.

