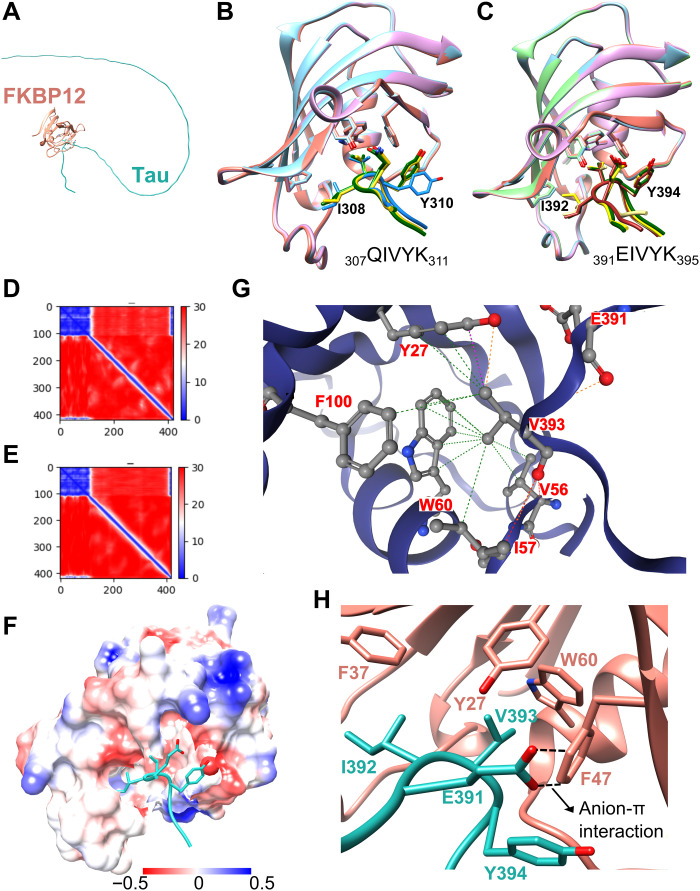
Fig. 5. Structural model of the tau/FKBP12 complex.
(A) Schematic representation of FKBP12 (orange) interacting with the disordered tau protein (cyan). (B and C) Ensemble of complex structures predicted by AlphaFold2 for the interaction of FKBP12 with 307QIVYK311 (B) and 391EIVYK395 (C) of tau. The three (B) and four (C) most similar peptide conformations (from five calculated models) are shown. (D and E) Residue-specific predicted alignment error (22) plots generated by AlphaFold2 for one of the representative complex structures shown in (B) and (C), respectively. Because FKBP12 and the tau sequences were connected by a 300-residue poly-glycine linker for the AlphaFold2 calculations, FKBP12 residues are found at positions 1 to 108 and the tau sequences at positions 409 to 419. (F to H) Structure of 391EIVYK395 of tau (cyan) bound to the hydrophobic surface of FKBP12 as predicted by AlphaFold2 (22). The electrostatic surface potential of FKBP12 is displayed in (F) with positive and negative charges shown in blue and red, respectively. The interaction interface is highlighted in (G) and (H). The hydrophobic interaction of V393 of tau with F100, W60, V56, and Y27 of FKBP12 is shown in (G). The anion-π interaction between E391 of tau and F47 of FKBP12 is marked by dashed lines in (H).

