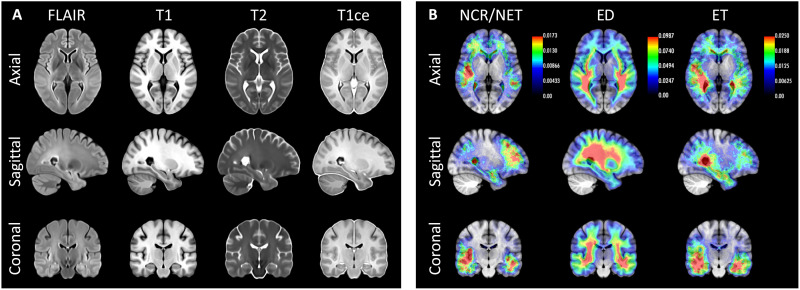
Fig. 5. Population templates and probabilistic maps of tumor subregions for the BraTS dataset.
(A) Axial, sagittal, and coronal slices of the group-wise median templates of the four available modalities. (B) Average spatial distribution maps of necrotic and non-enhancing tumor core (NCR/NET), peritumoral edema (ED), and gadolinium-enhancing tumor (ET). The orientation of the images follows radiological convention. The overlaid heatmaps show the probability of observing each tumor class at every voxel, as encoded in the color bars.

