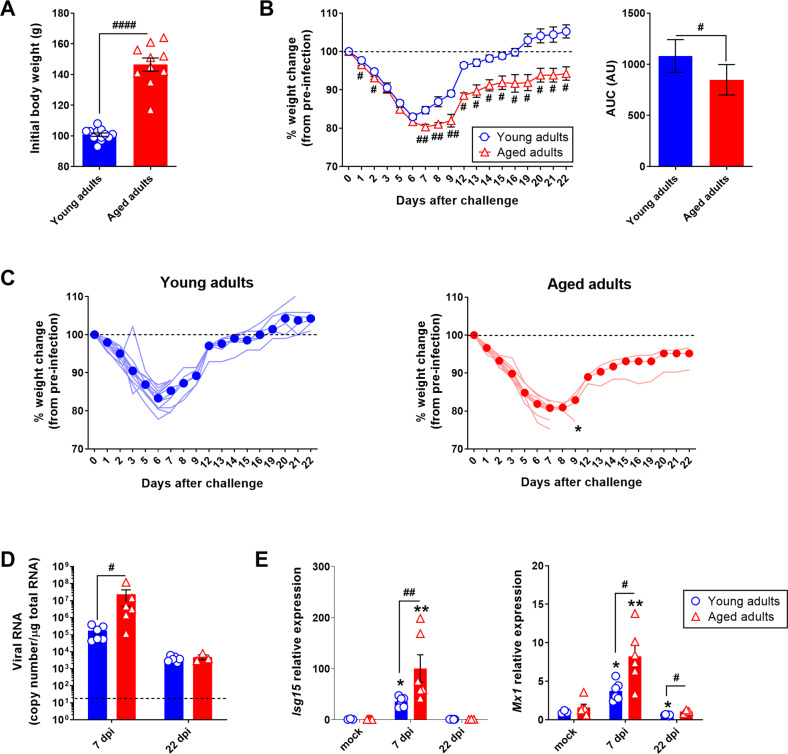
Fig. 1. SARS-CoV-2 infection is more severe in aged golden hamsters.
Golden (Syrian) hamsters aged 2 months (the “young adults” group) or 22 months (the “aged adults” group) were treated intranasally with a SARS-CoV-2 inoculate (n = 12 young adults and n = 10 aged adults) or with DMEM (mock infection) (n = 6 young adults and n = 6 aged adults). A Body weight (g) on the day of infection. Data are expressed as the mean ± SEM, and individual replicates are shown (n = 12 young adults and n = 10 aged adults). B Percentage body weight change after infection (left). Data are expressed as the mean ± SEM (n = 12 young adults and n = 10 aged adults). The corresponding area under the curve (AUC) is shown (right). Data are expressed in arbitrary units (AU). C Percentage body weight change after infection in individual animals. Median weight losses are depicted as plain circles. Asterisks indicate death. D Quantification of SARS-CoV-2 RNA in the lungs of young adult and aged adult hamsters, using an RT-qPCR assay. Viral RNA levels are expressed as the mean ± SEM copy number/μg of total RNA, and individual replicates are shown (mock and 7 days post infection (dpi): n = 6 animals per group, 22 dpi: n = 6 young adults and n = 3 aged adults). The dashed line represents the assay’s limit of detection. E mRNA expression levels (RT-qPCR assay) of the Isg15 and Mx1 genes in the lungs of young adult and aged adult hamsters, presented according to the 2−ΔΔCT method (housekeeping gene: Actg1, coding for gamma (γ) actin). Data are expressed as the mean ± SEM, and individual replicates are shown (mock and 7 dpi: n = 6 animals per group, 22 dpi: n = 6 young adults and n = 3 aged adults). Groups were compared in a two-sided Mann–Whitney test; # indicates the P values for the comparison of young adults and aged adults (the effect of age: #P < 0.05, ##P < 0.01 and ####P < 0.0001), and * indicates the P values for the comparison of mock-treated and SARS-CoV-2-infected groups (the effect of infection: *P < 0.05 and **P < 0.01). For intergroup differences, the threshold for statistical significance was set to P < 0.05.

